 Julia Mapping
Figure gallery
Every figure from Julia Mapping: A Practical Guide, sized for screens, grouped by chapter. Tap a figure for the full-size image and zoom as needed. Figures are shown in book order within each chapter.
Chapters
- Getting started with Julia
- Bringing in data
- Geometry plus data makes spatial data
- Basic Plotting
- Colors
- Layout
- Counts data
- When color is not an option
- Insets and outsets
- Putting it all together
- Radius maps
- Network data
- Bivariate maps
- Dot density maps
- Geo-referenced rasters
- Catchment areas
- Cartograms
- Small multiples
- Spatial reasoning
Getting started with Julia
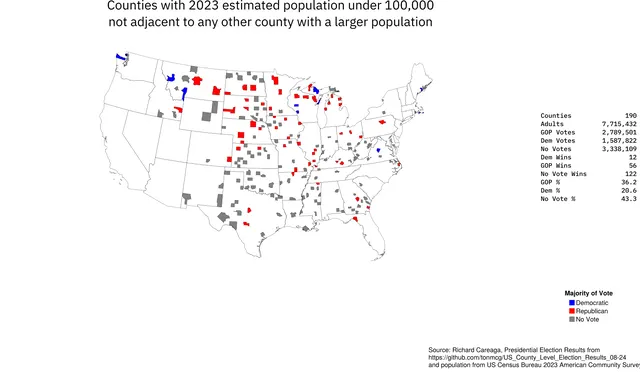
Example Thematic MapOpen full size 
Julia REPLOpen full size
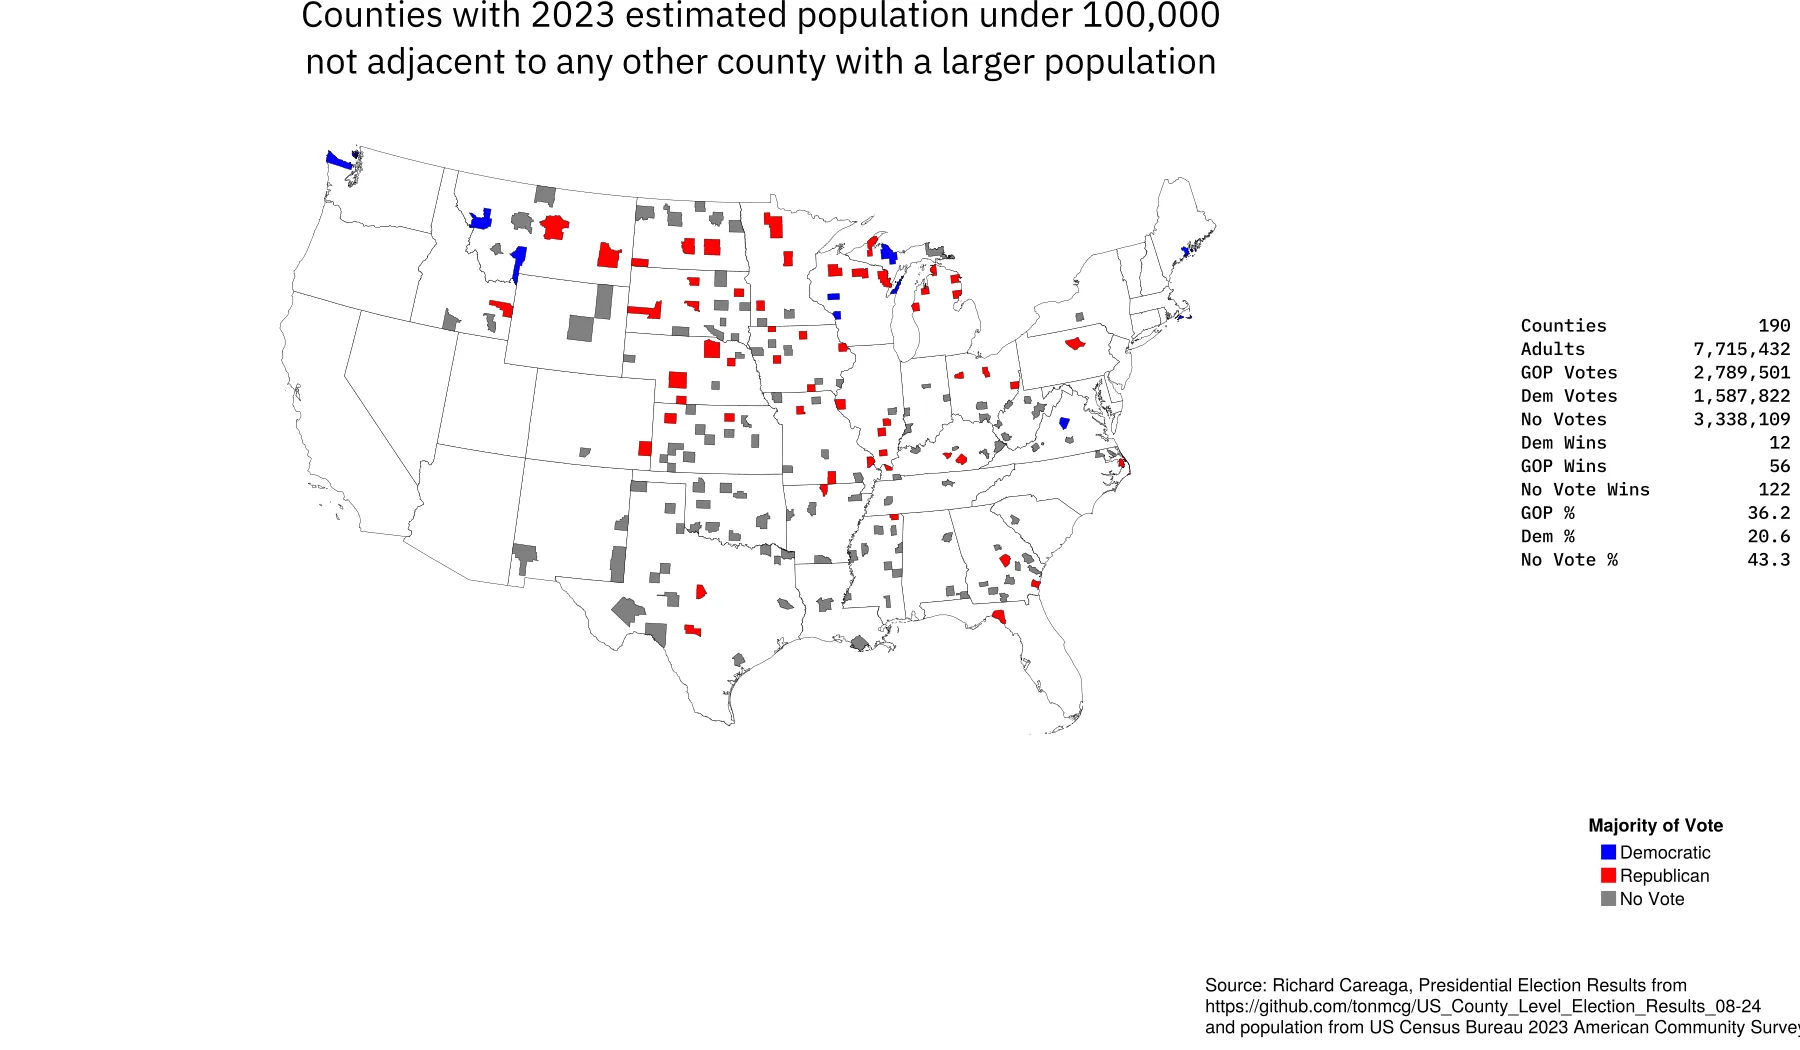

Bringing in data
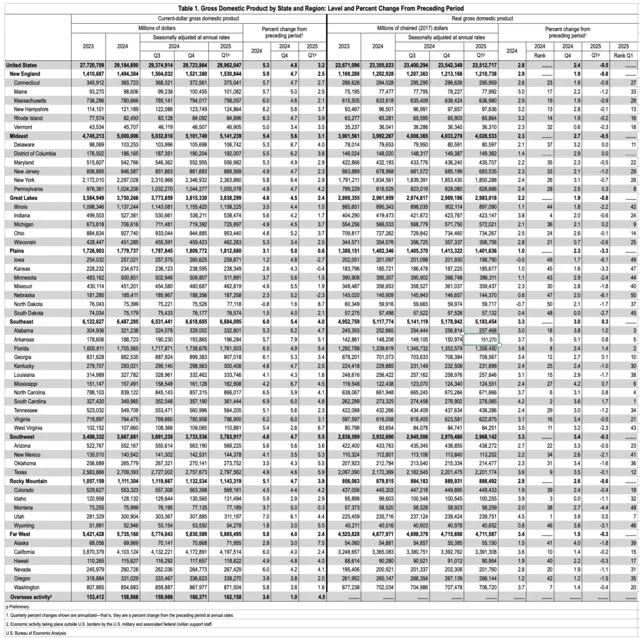
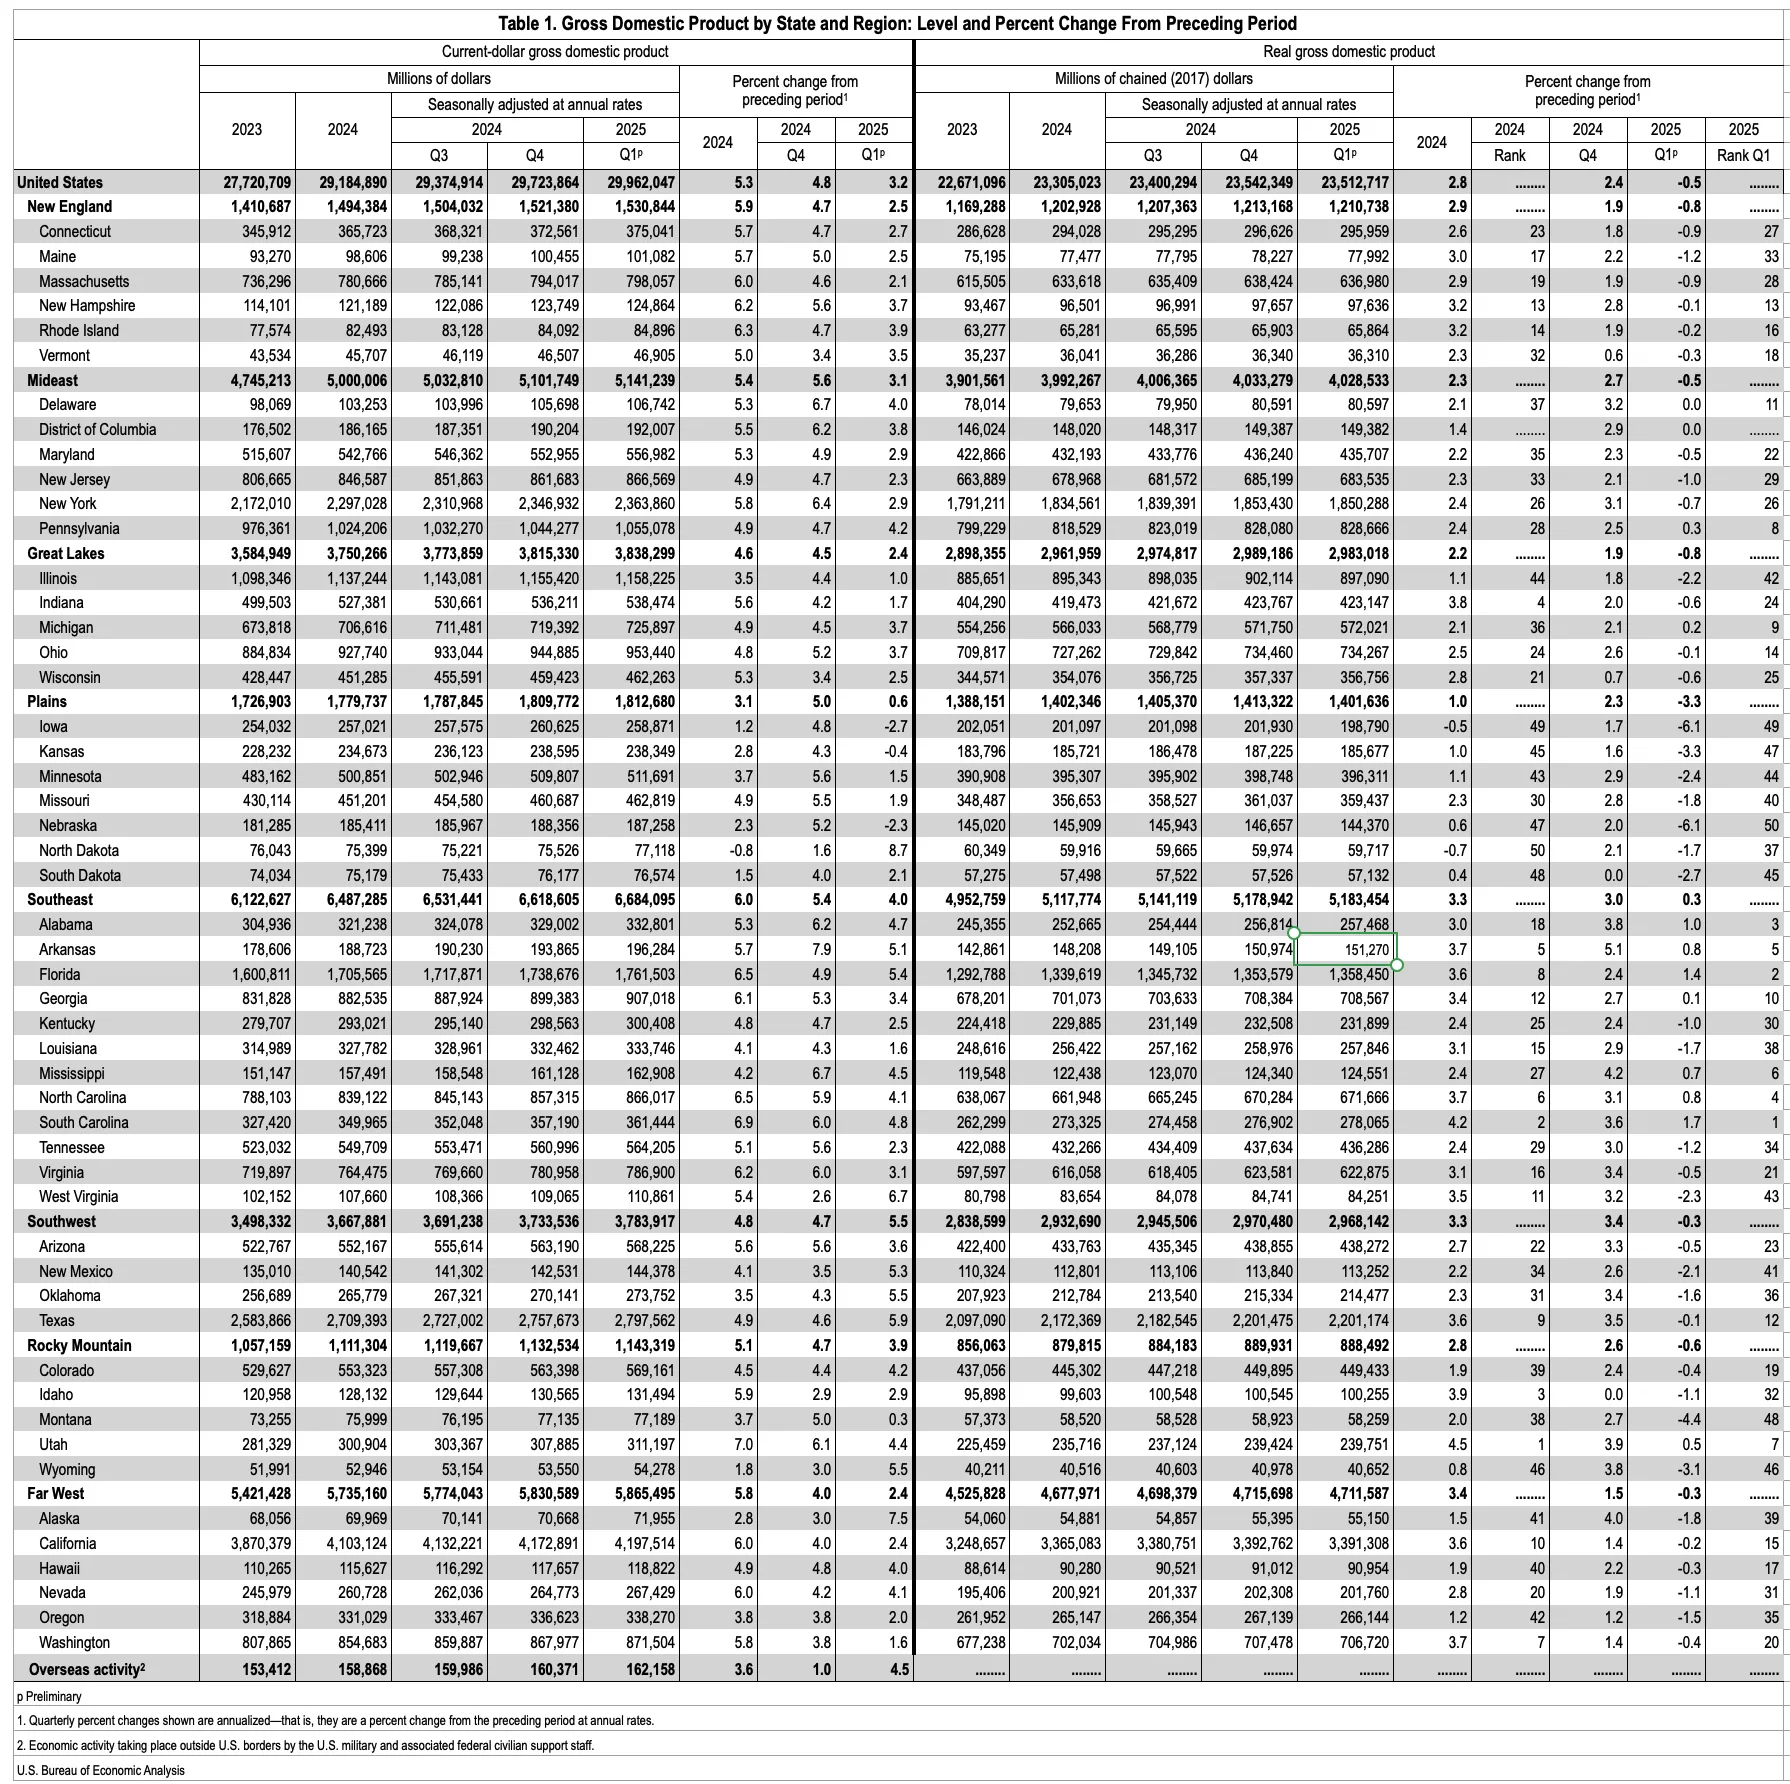
Example of an Overdecorated SpreadsheetOpen full size
Geometry plus data makes spatial data
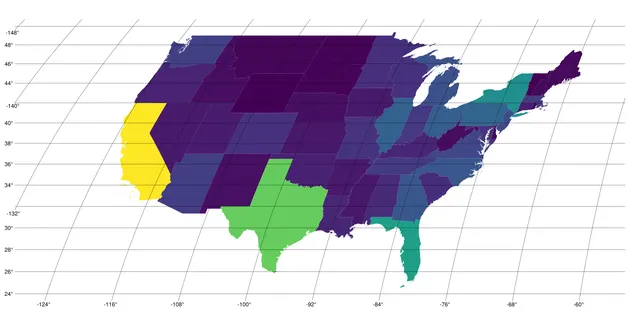
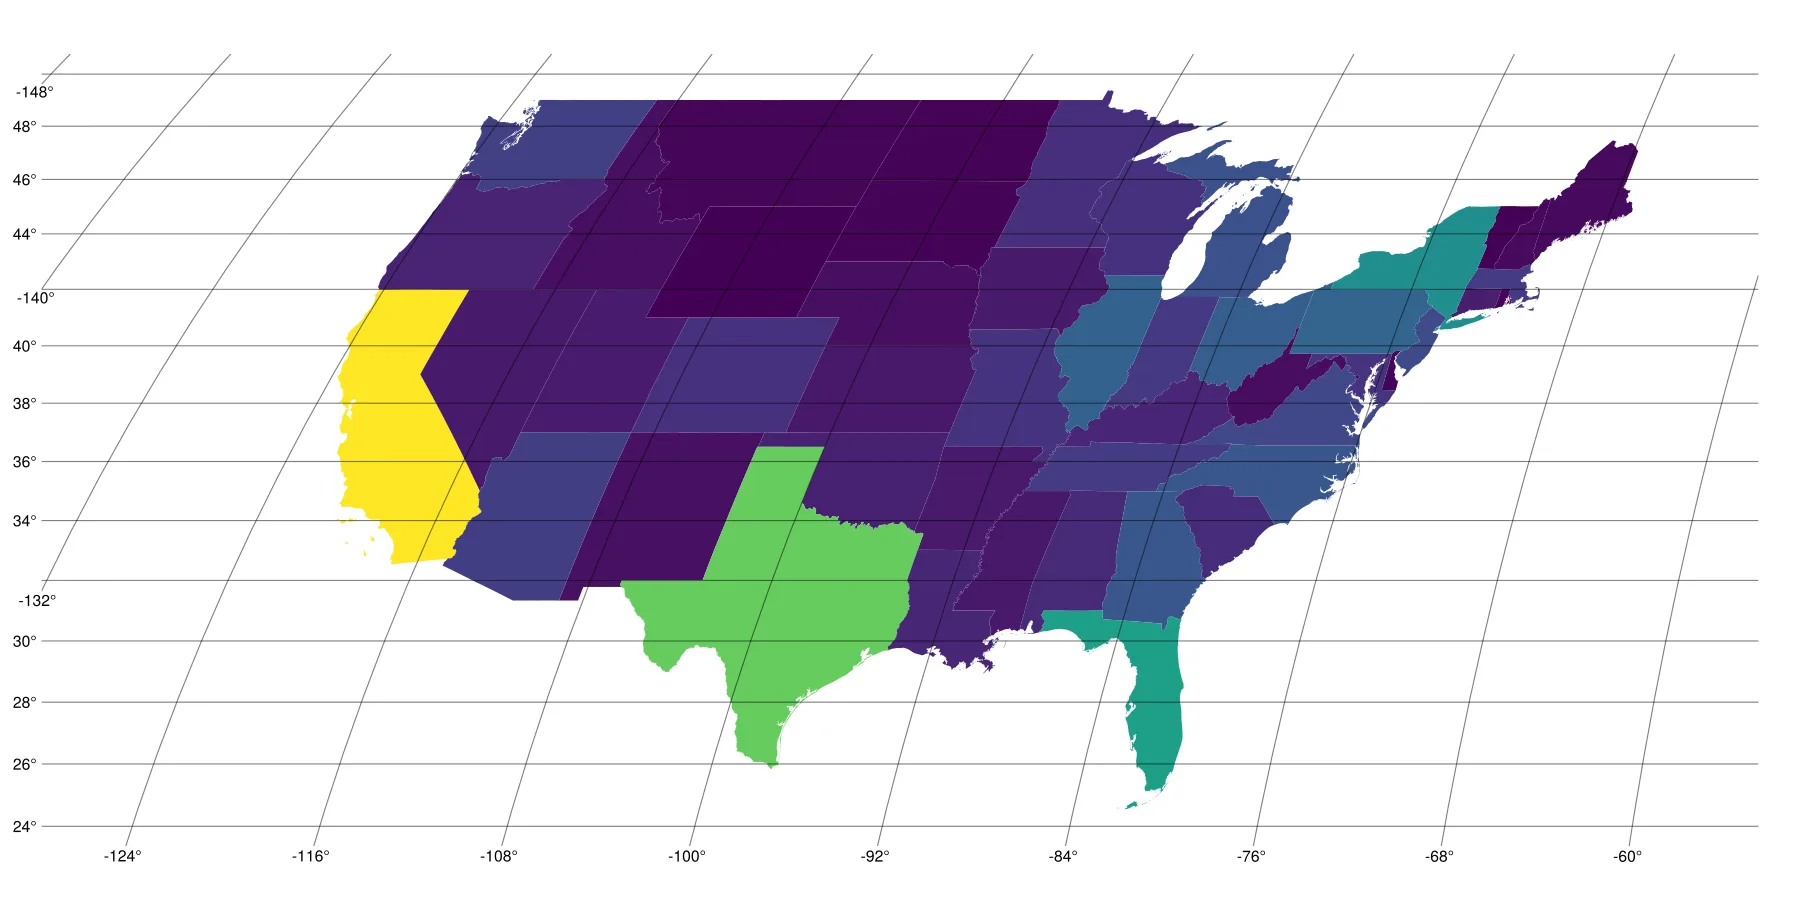
Map of US Population Taking Default ColorsOpen full size
Basic Plotting
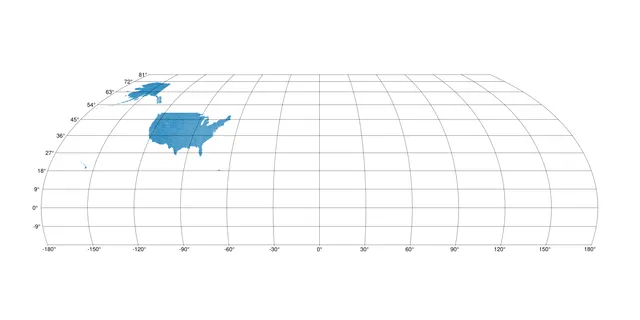
Typical Plot Accepting All the Defaults of a TIGER ShapefileOpen full size 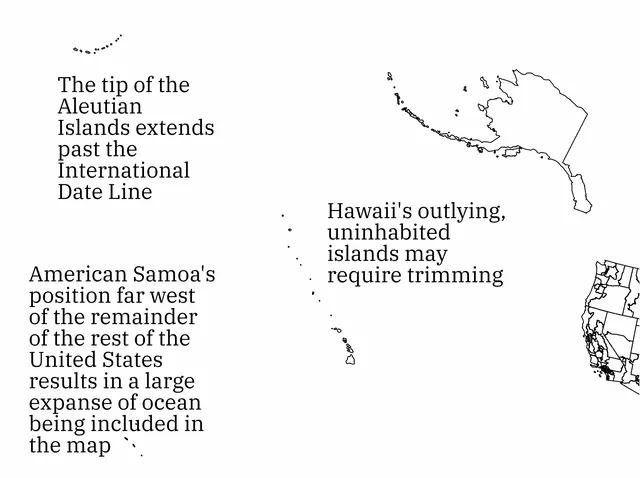
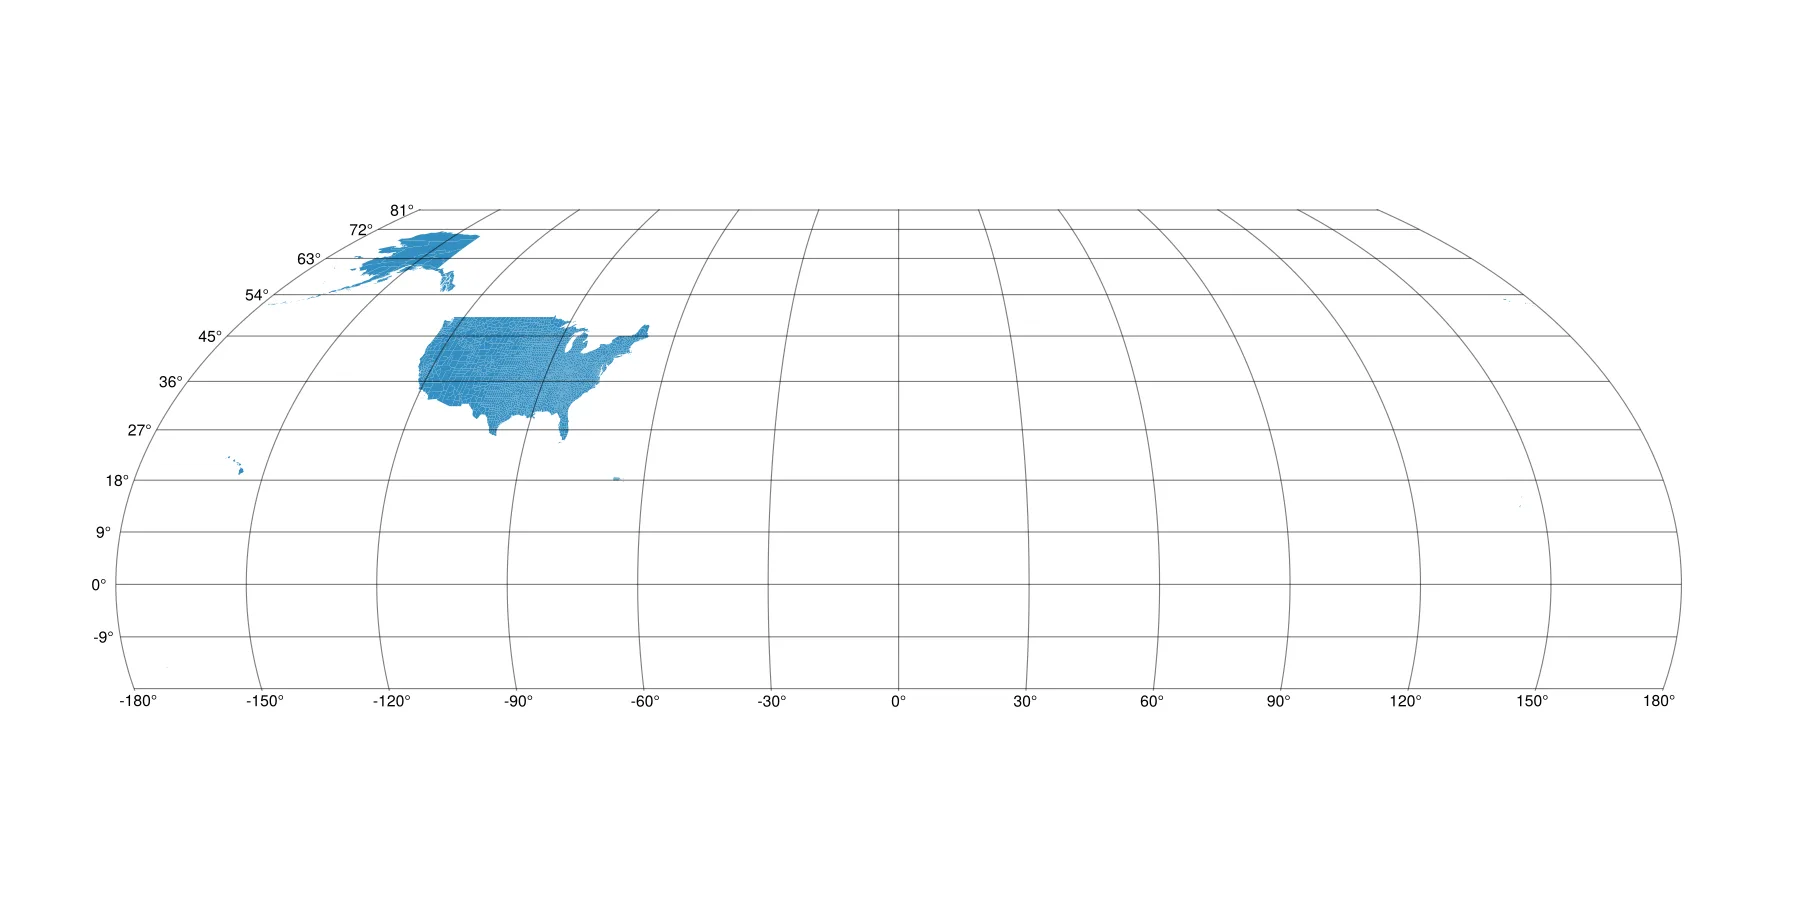
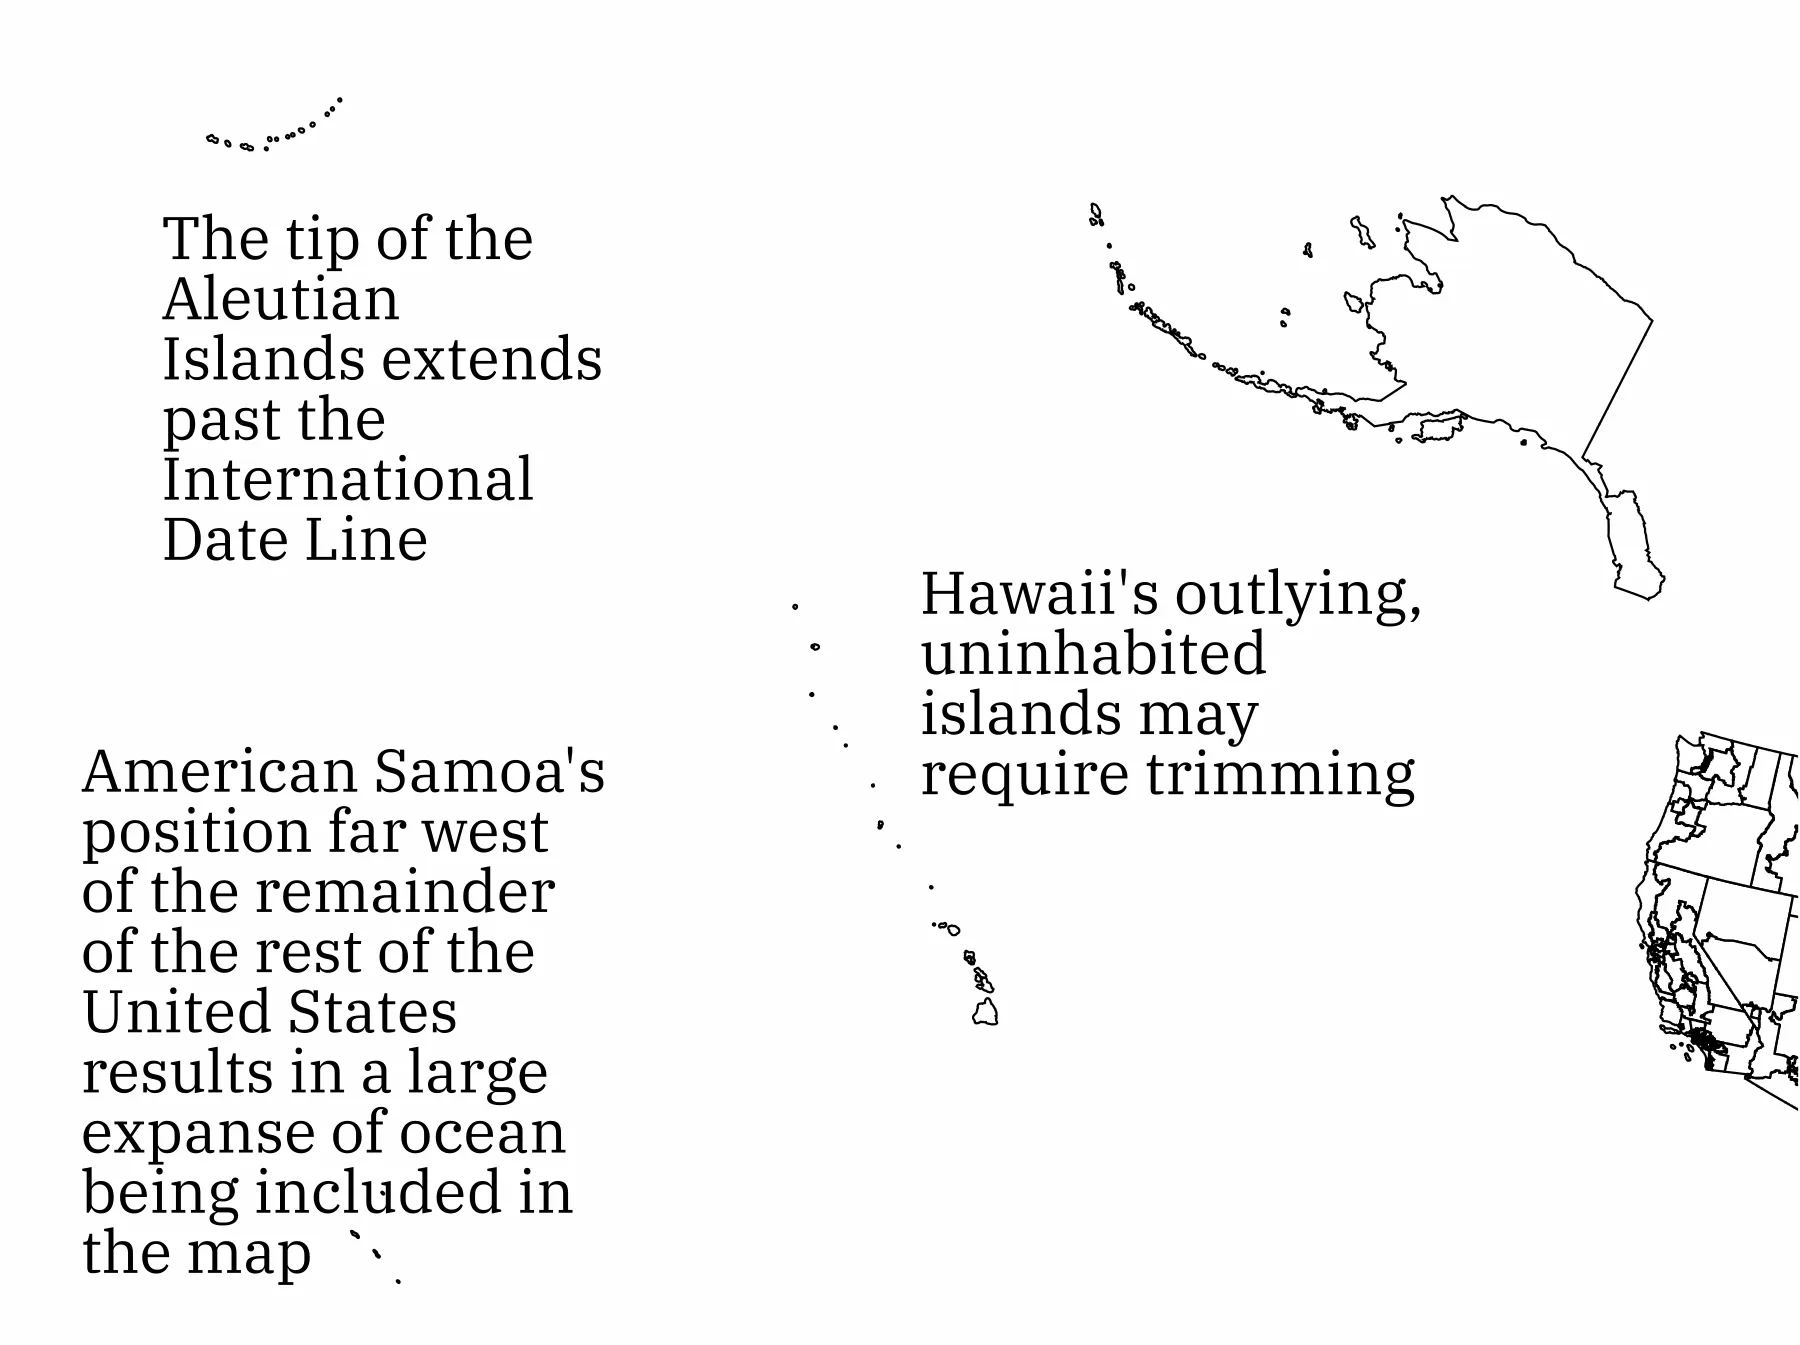
Some of the Far-flung GeographiesOpen full size 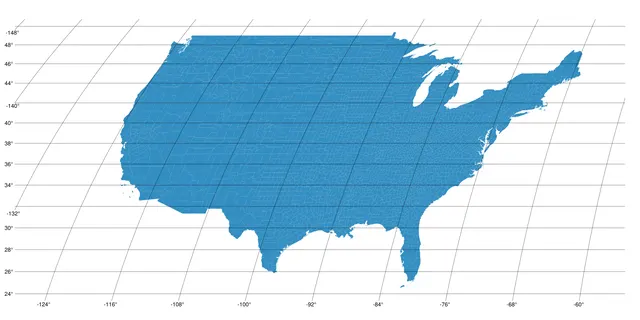
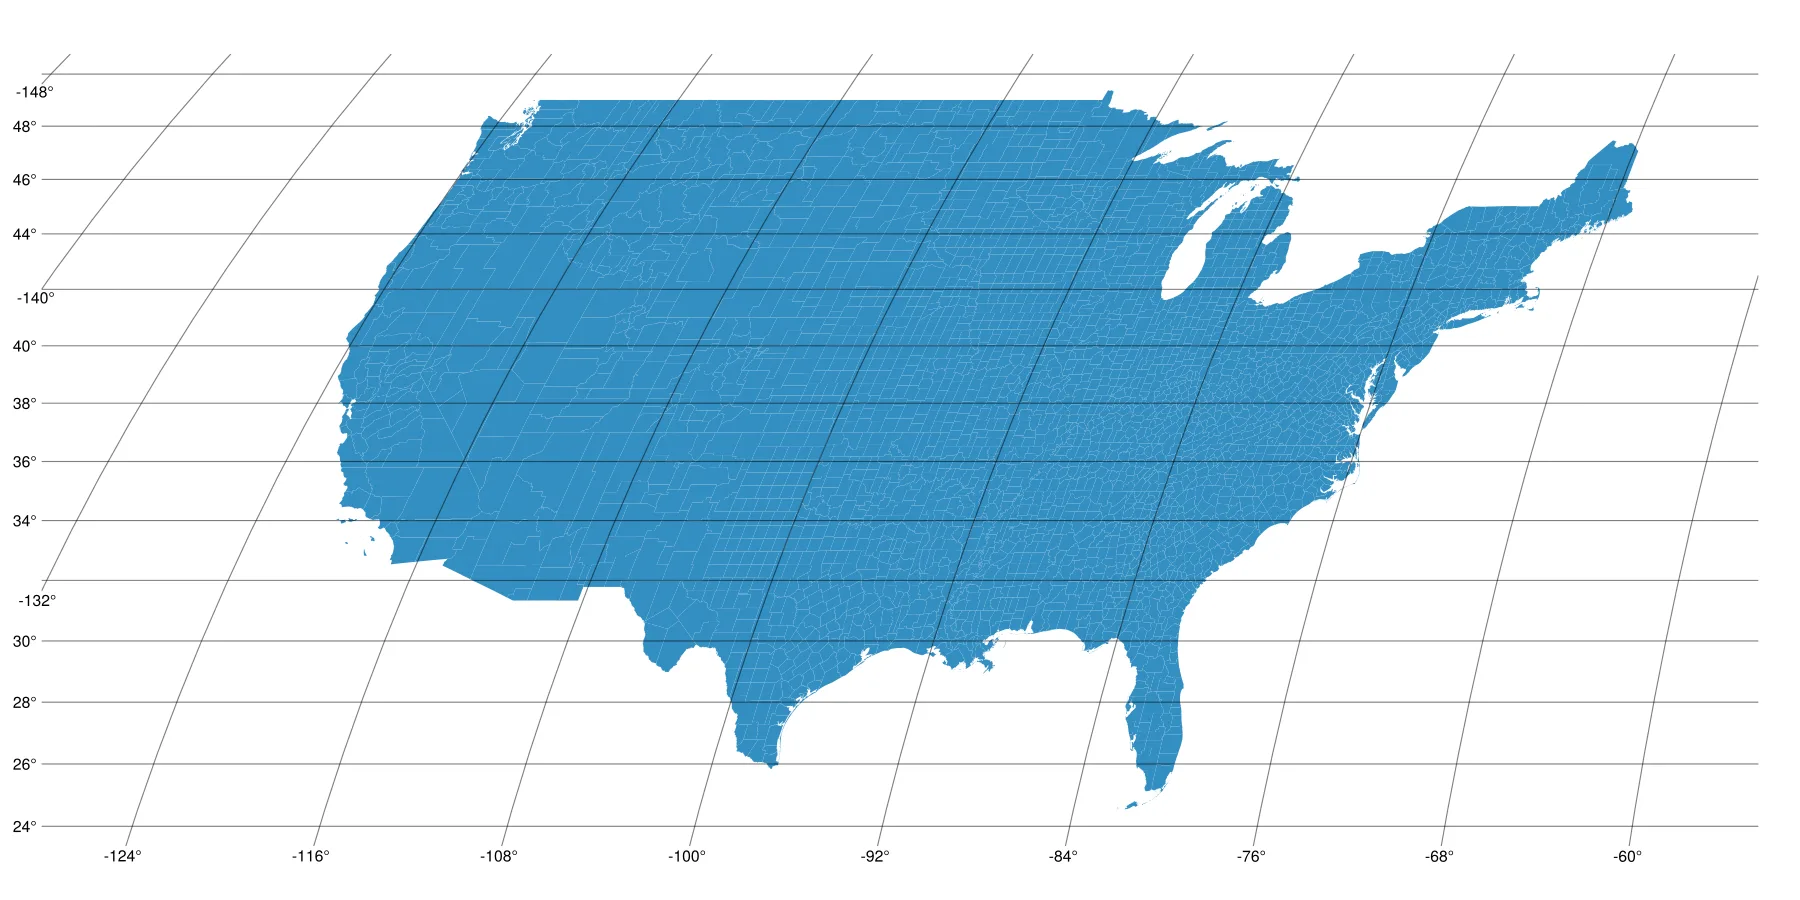
Contiguous USOpen full size 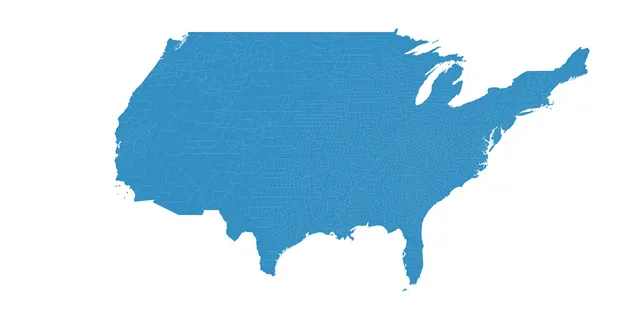
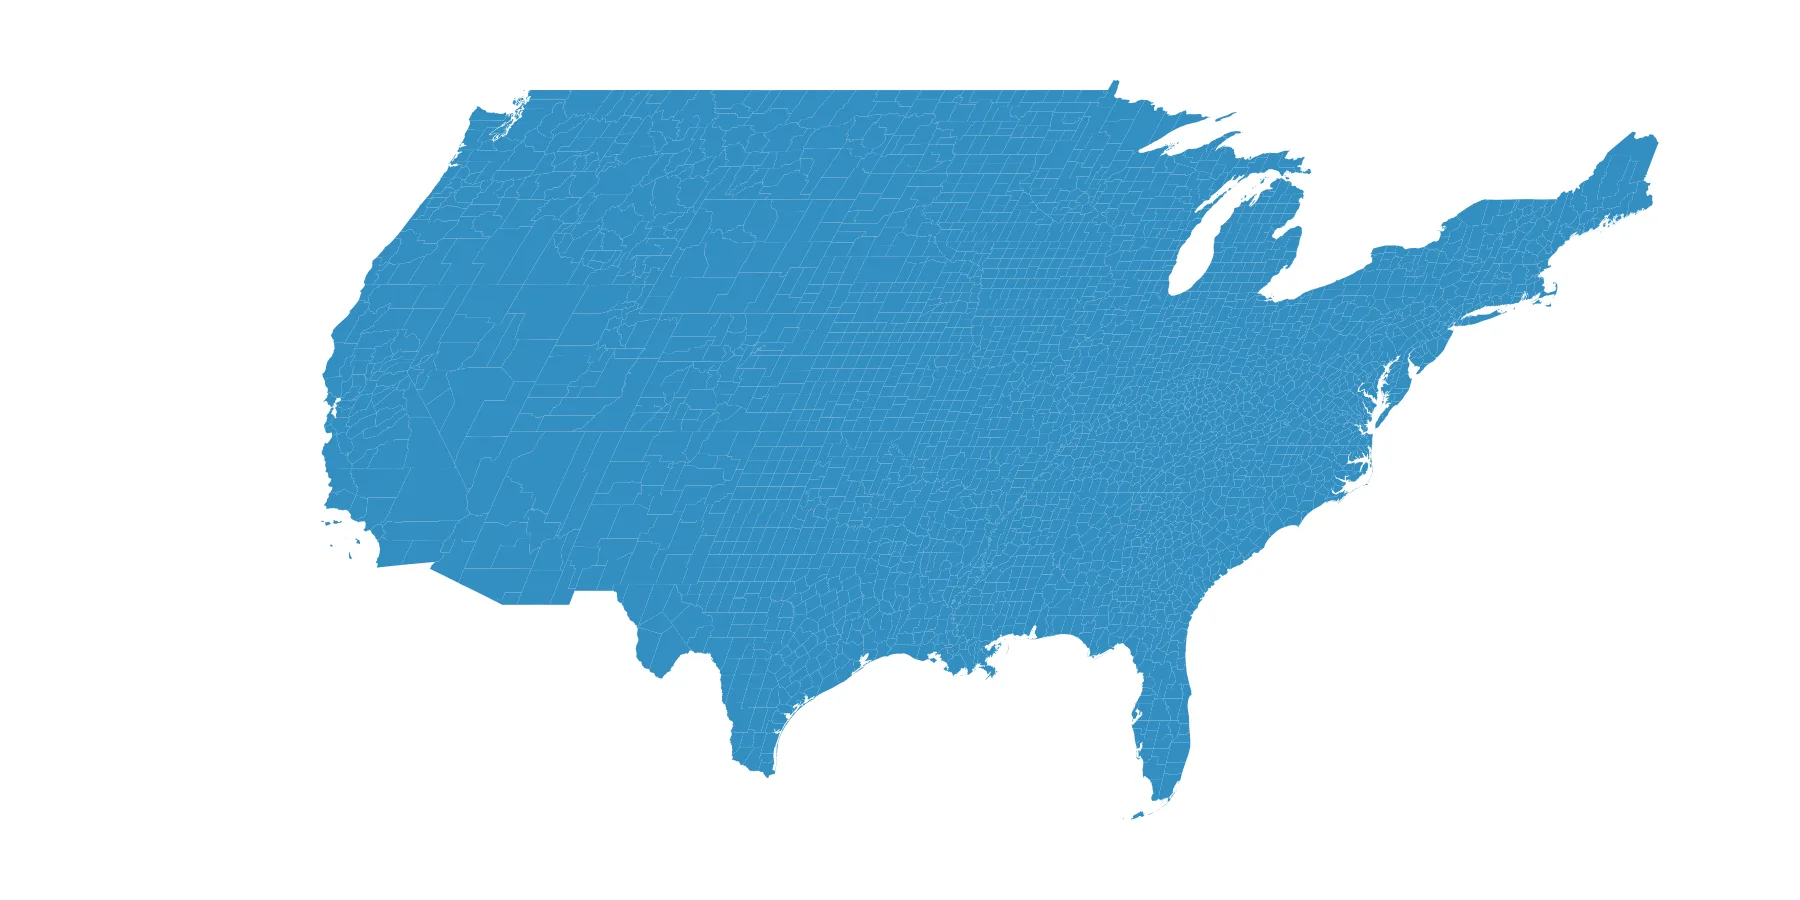
Contiguous US Without GraticuleOpen full size 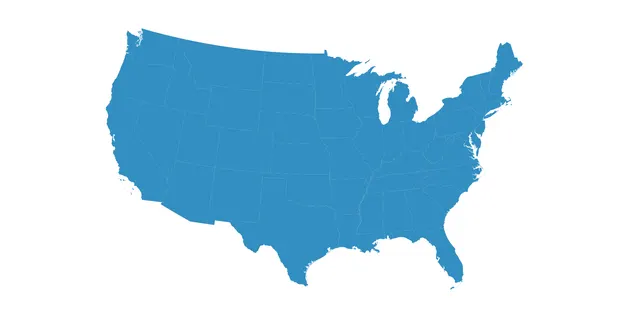
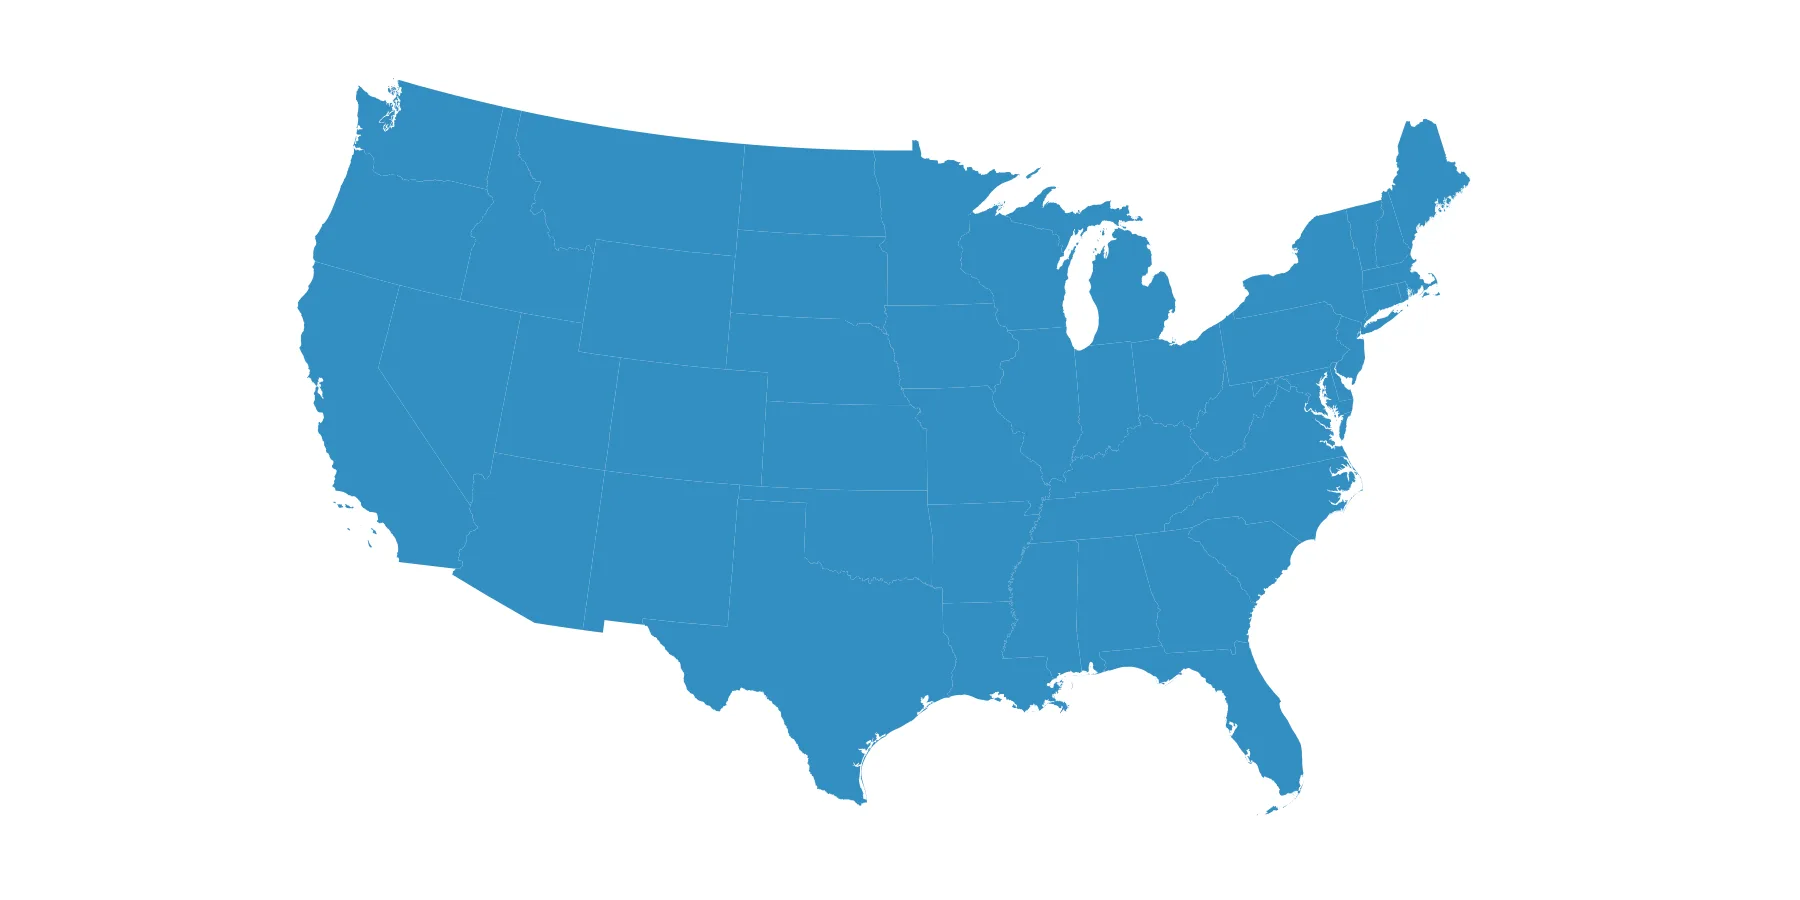
Contiguous US with Albers Equal Area ProjectionOpen full size
Colors
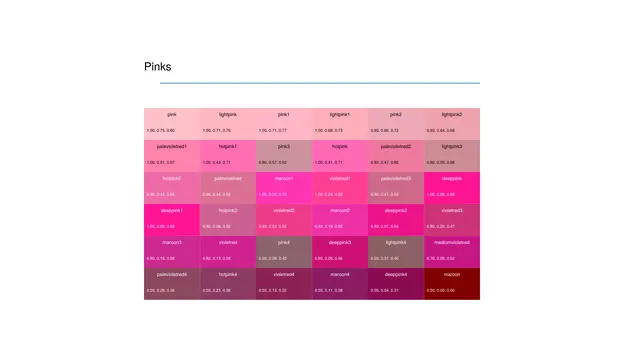
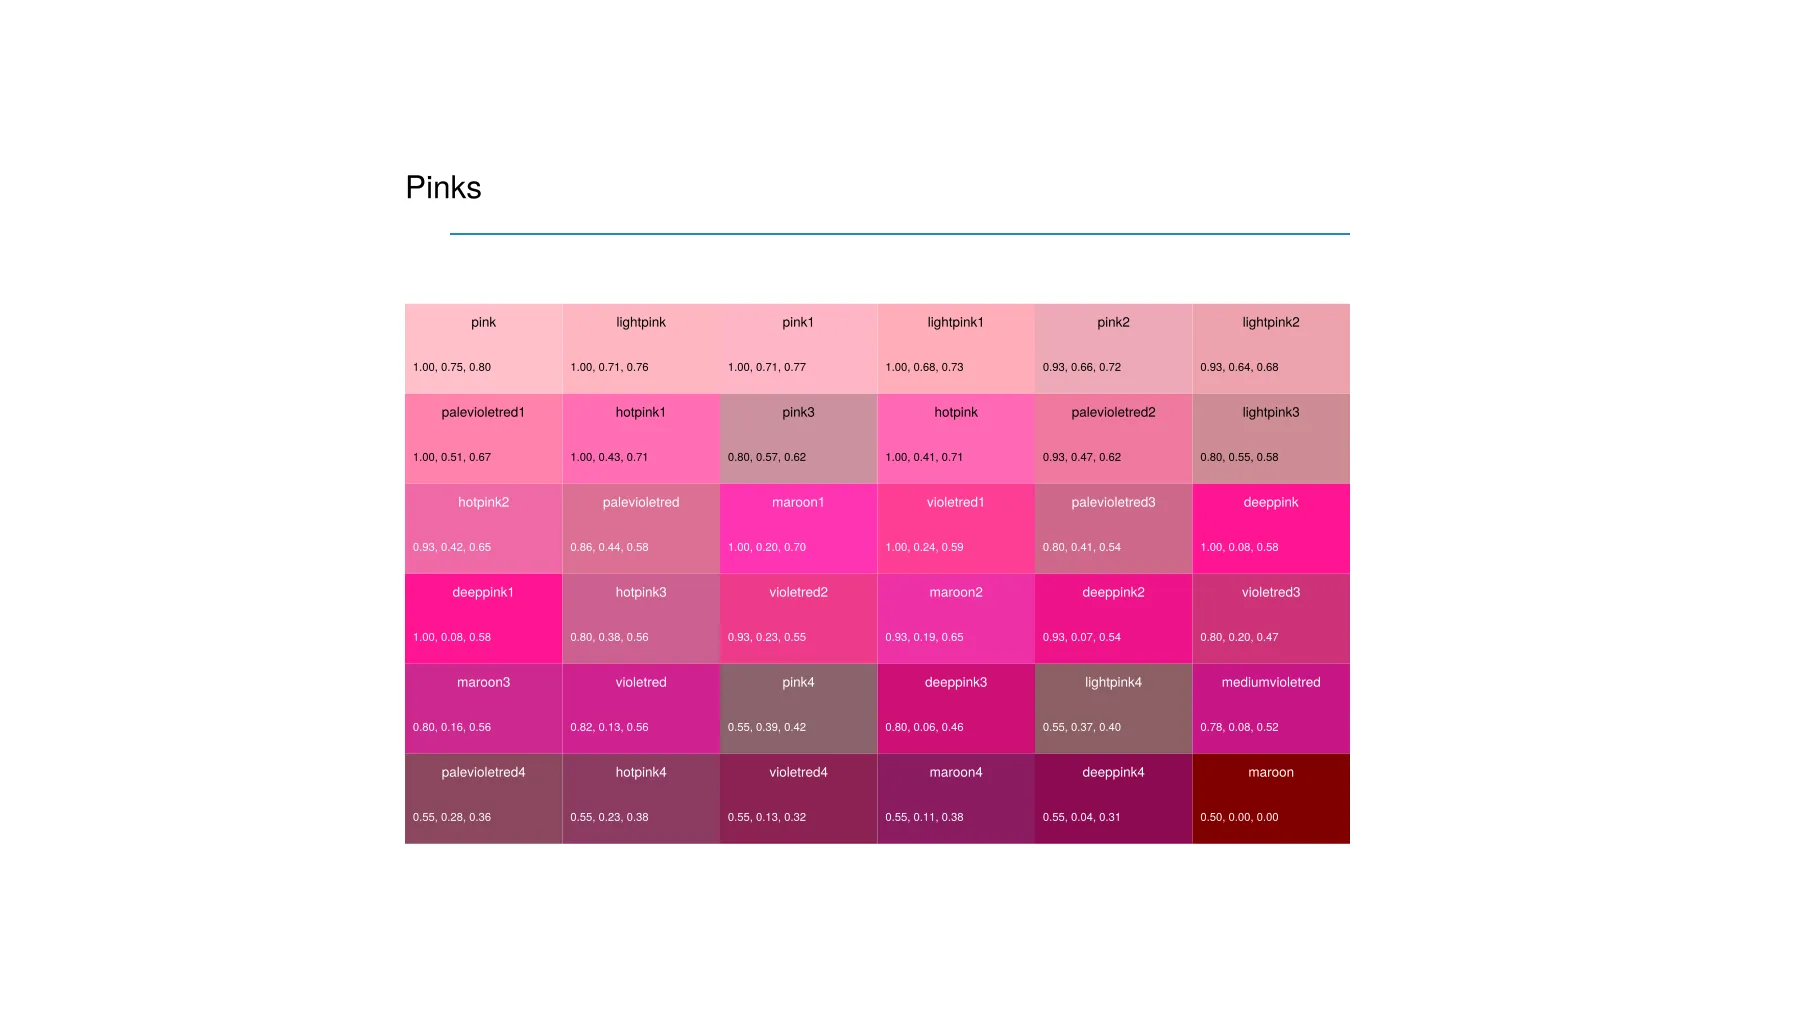
Pink Named ColorsOpen full size 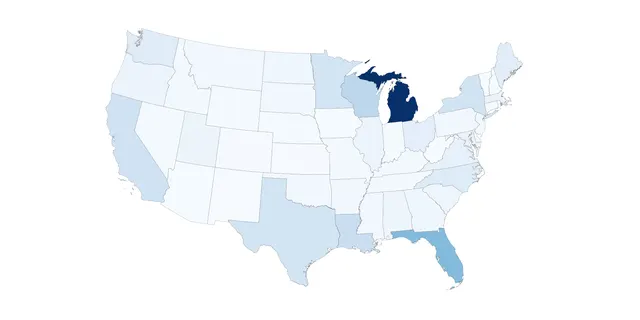
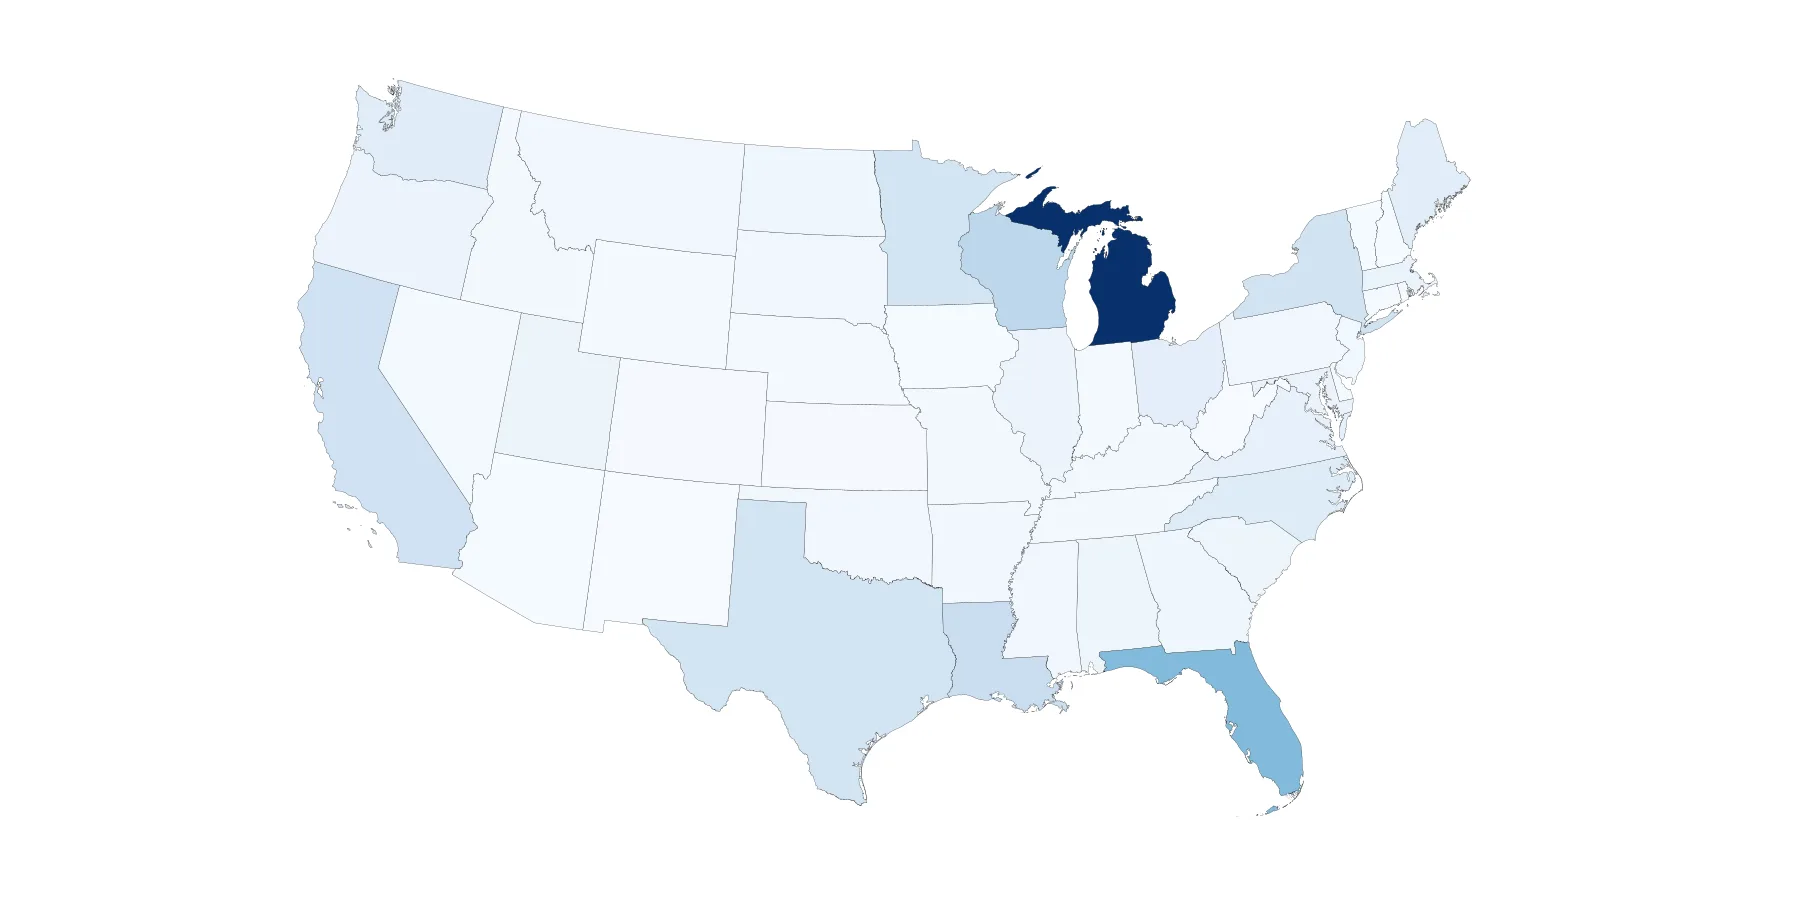
Sequential Color Palette ExampleOpen full size 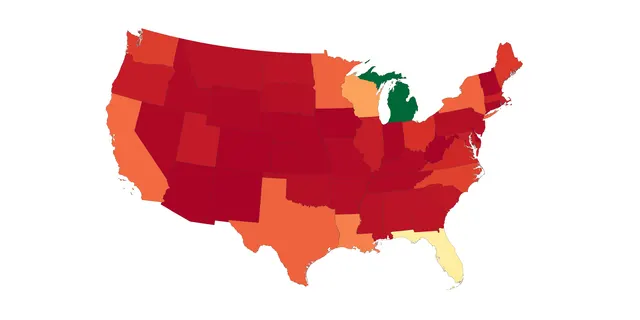
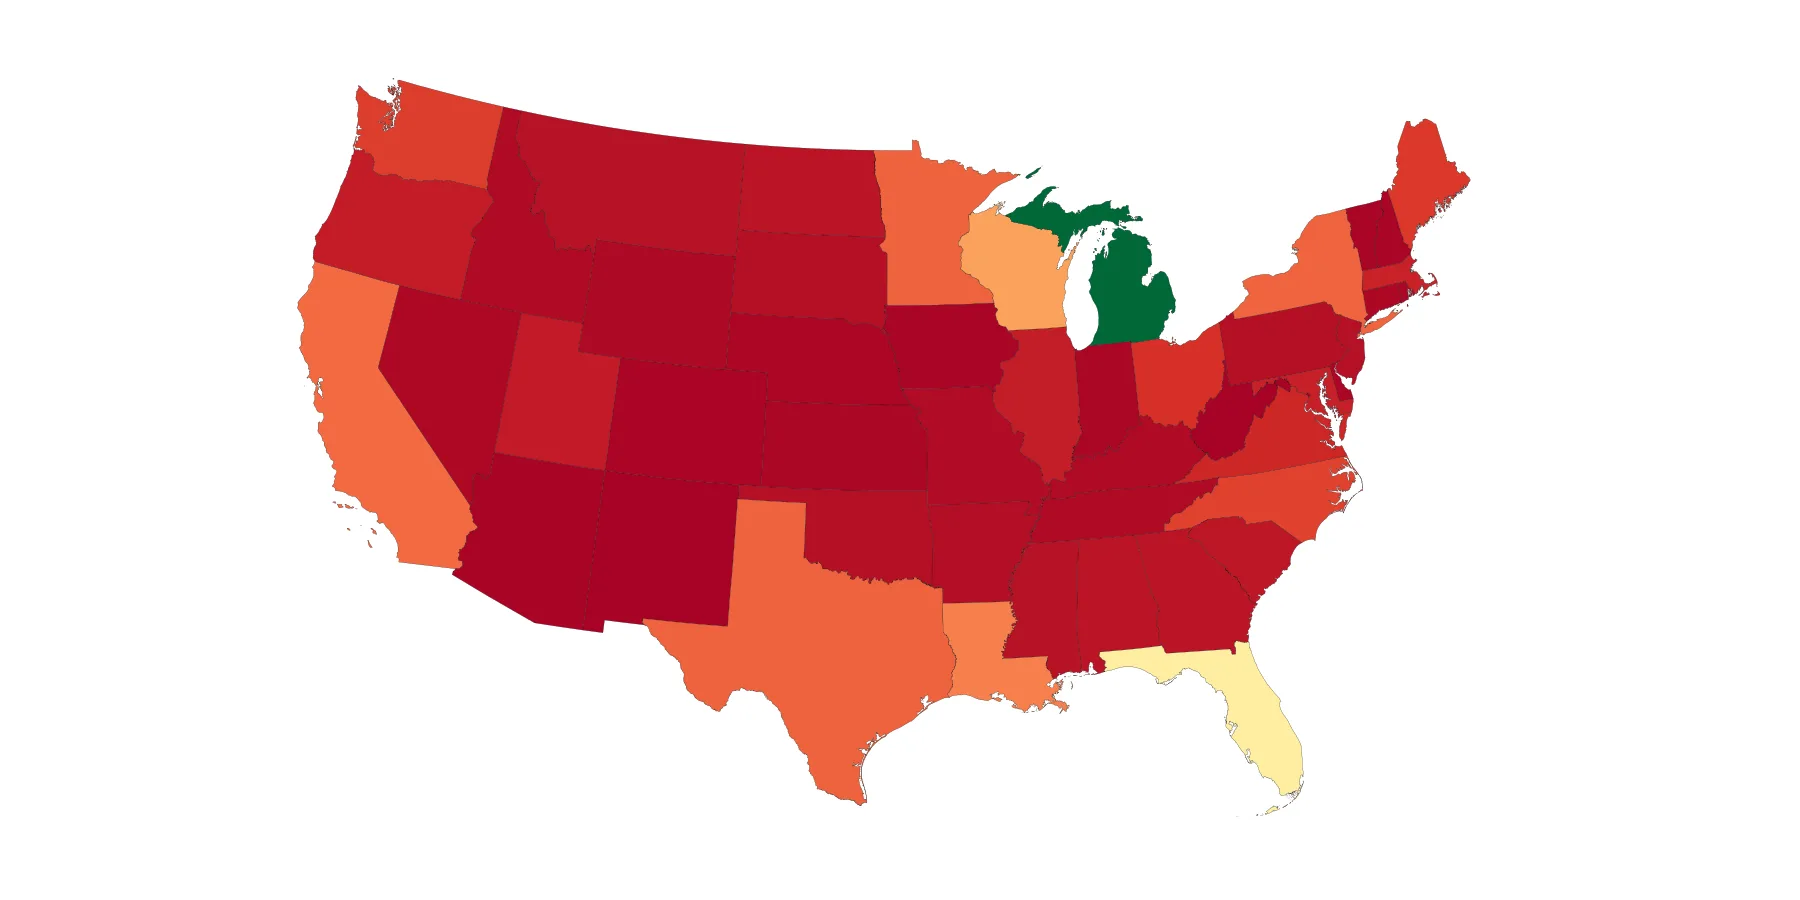
Diverging Color Palette Example of Water Area by StateOpen full size 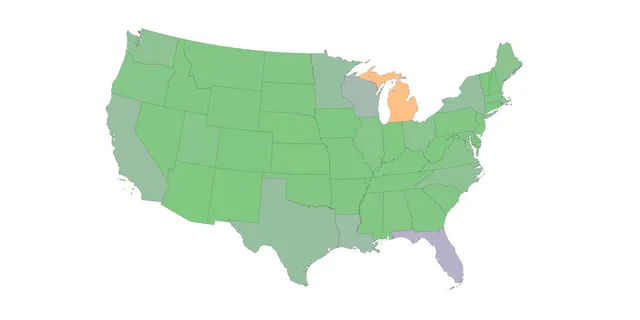
Qualitative Color Palette Example of Water Area by StateOpen full size 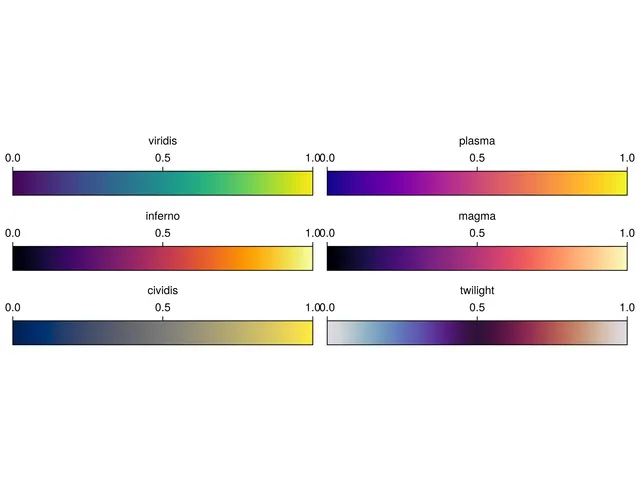
Some ColorSchemesOpen full size 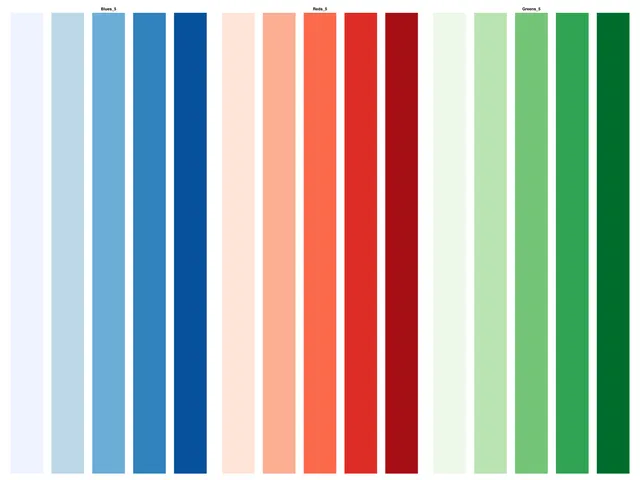
Blues_5, Reds_5 and Greens_5 ColorBrewer PalettesOpen full size
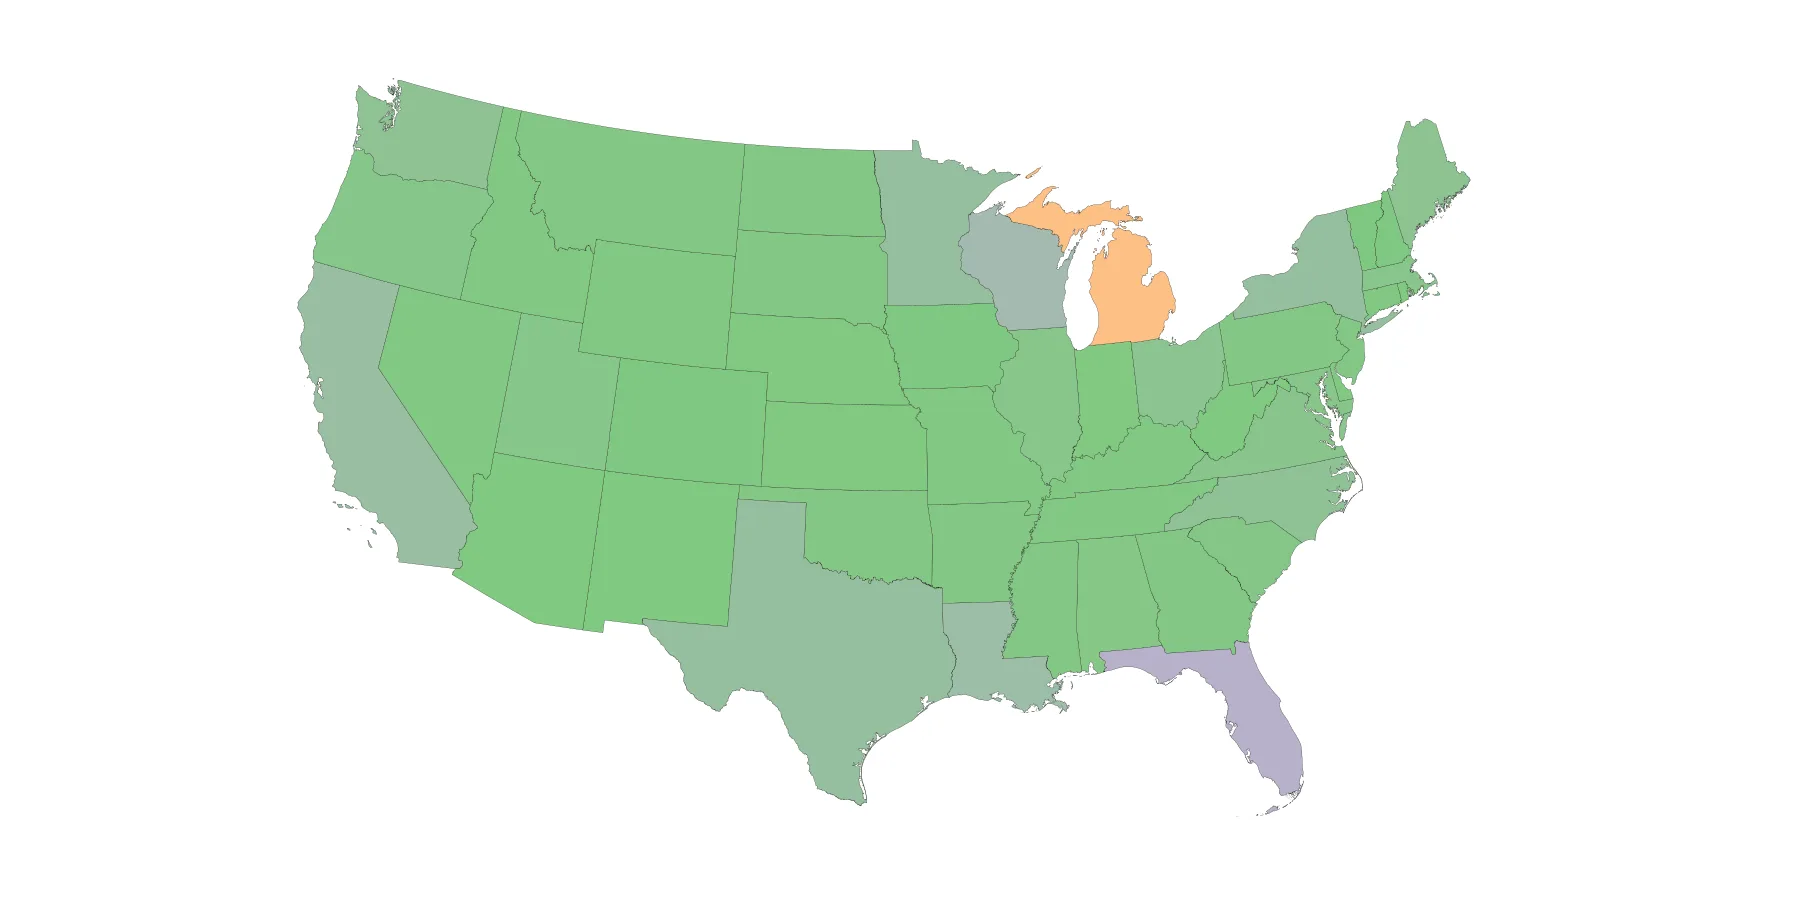
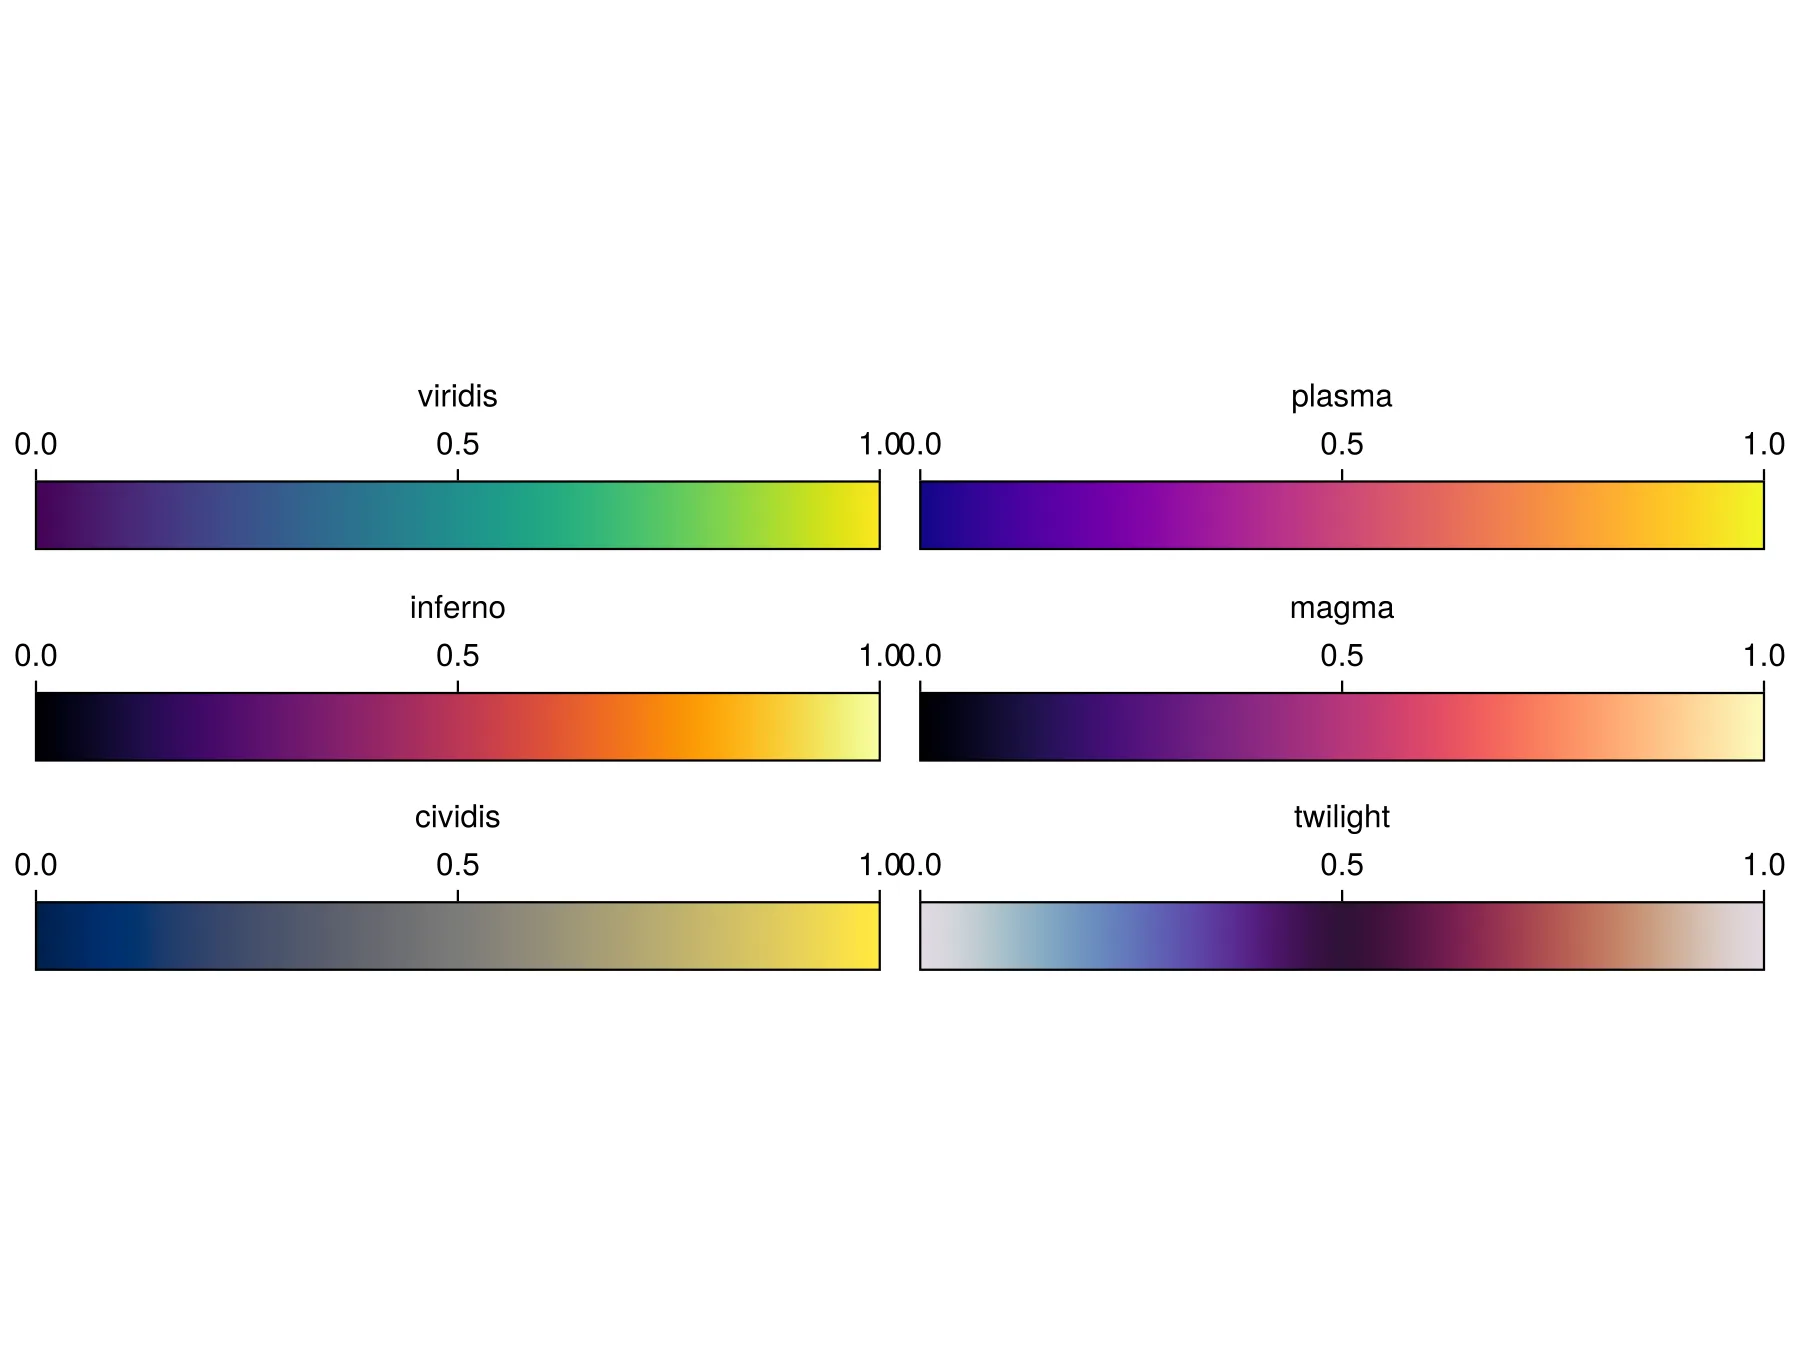
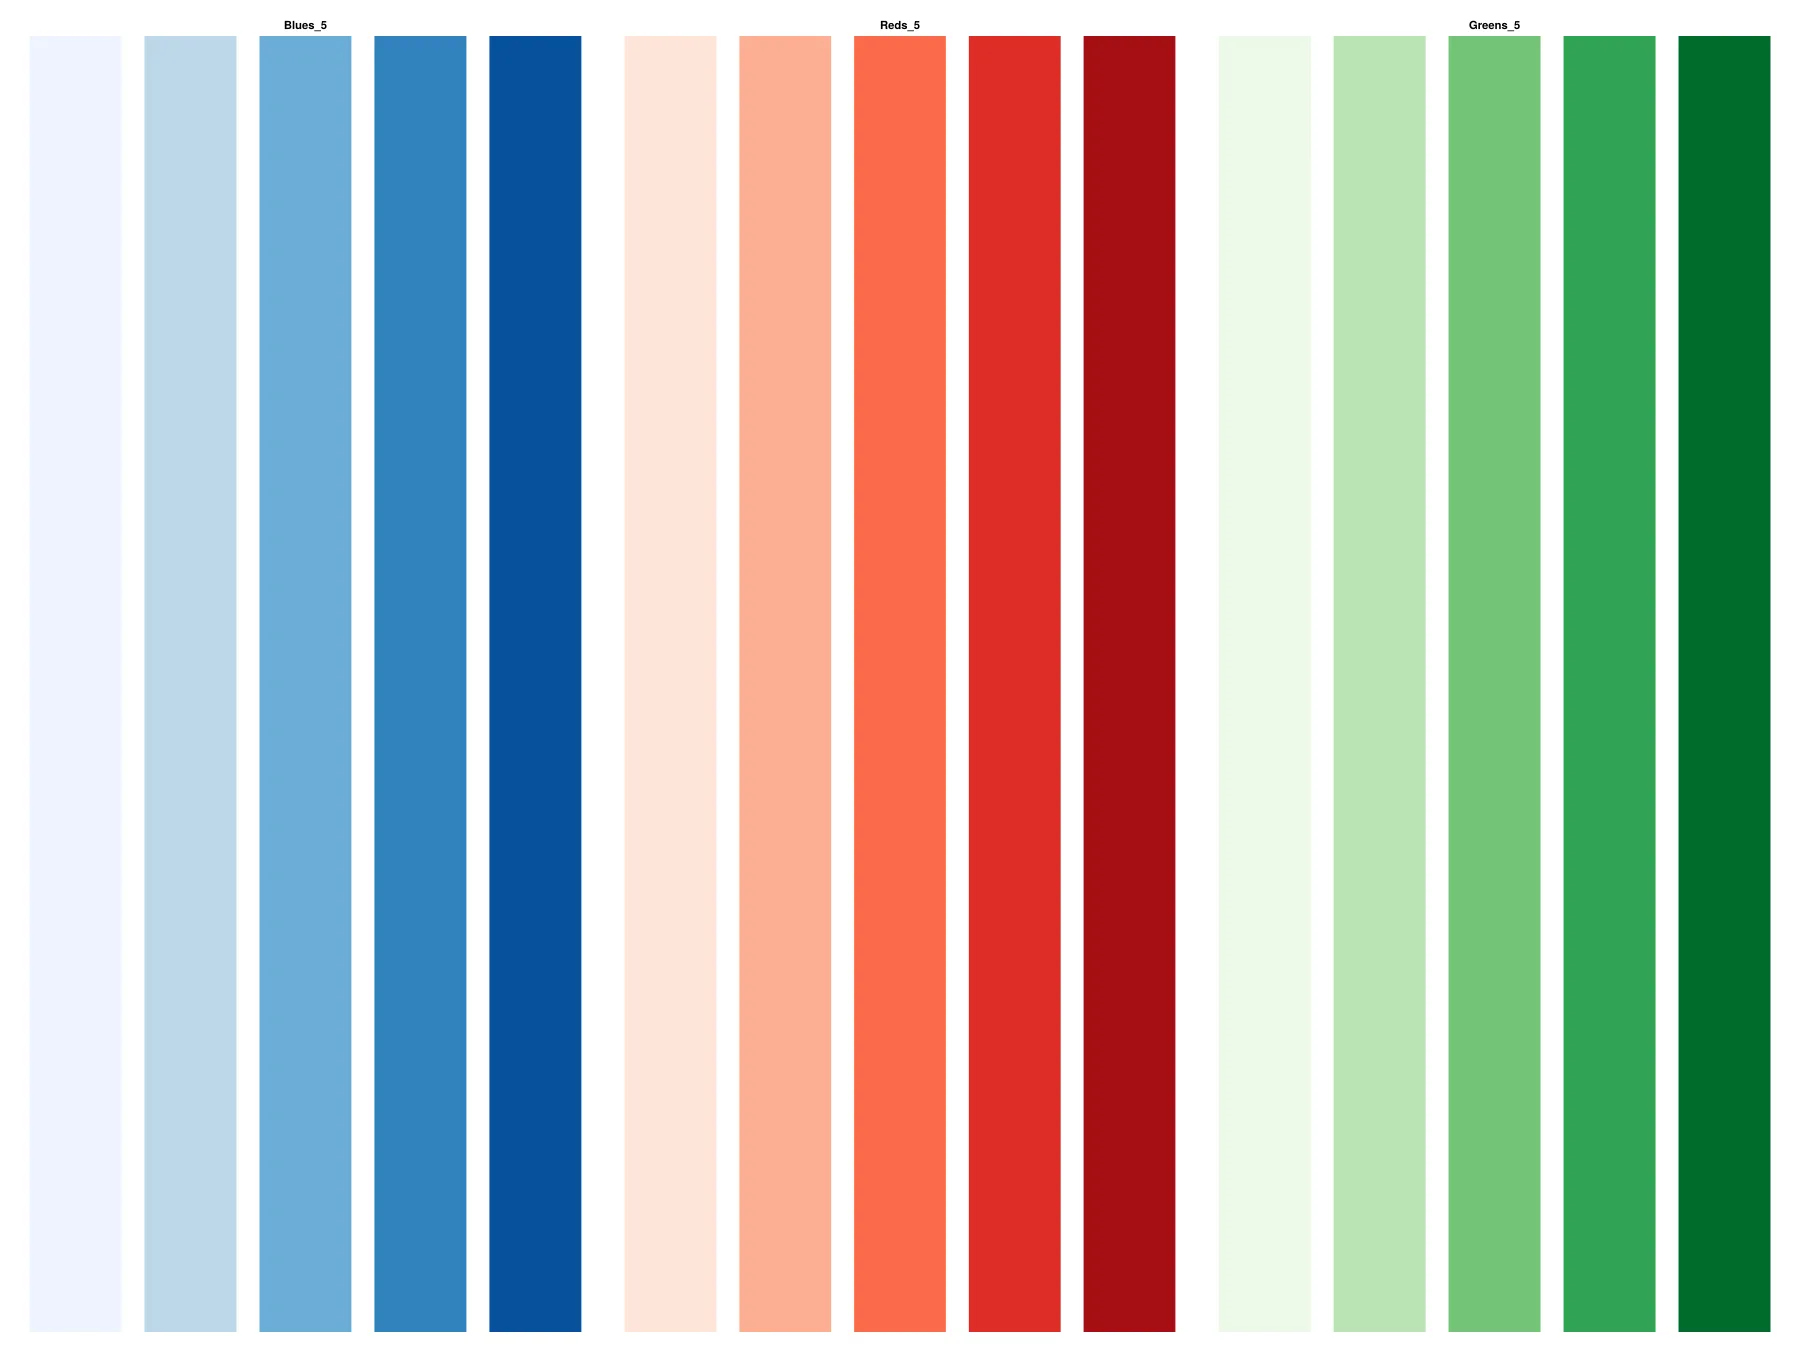
Layout
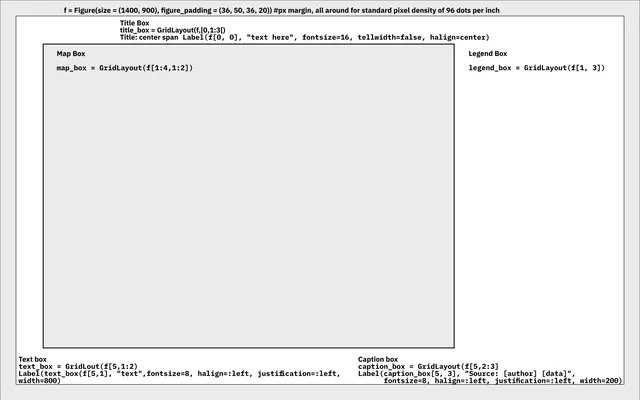
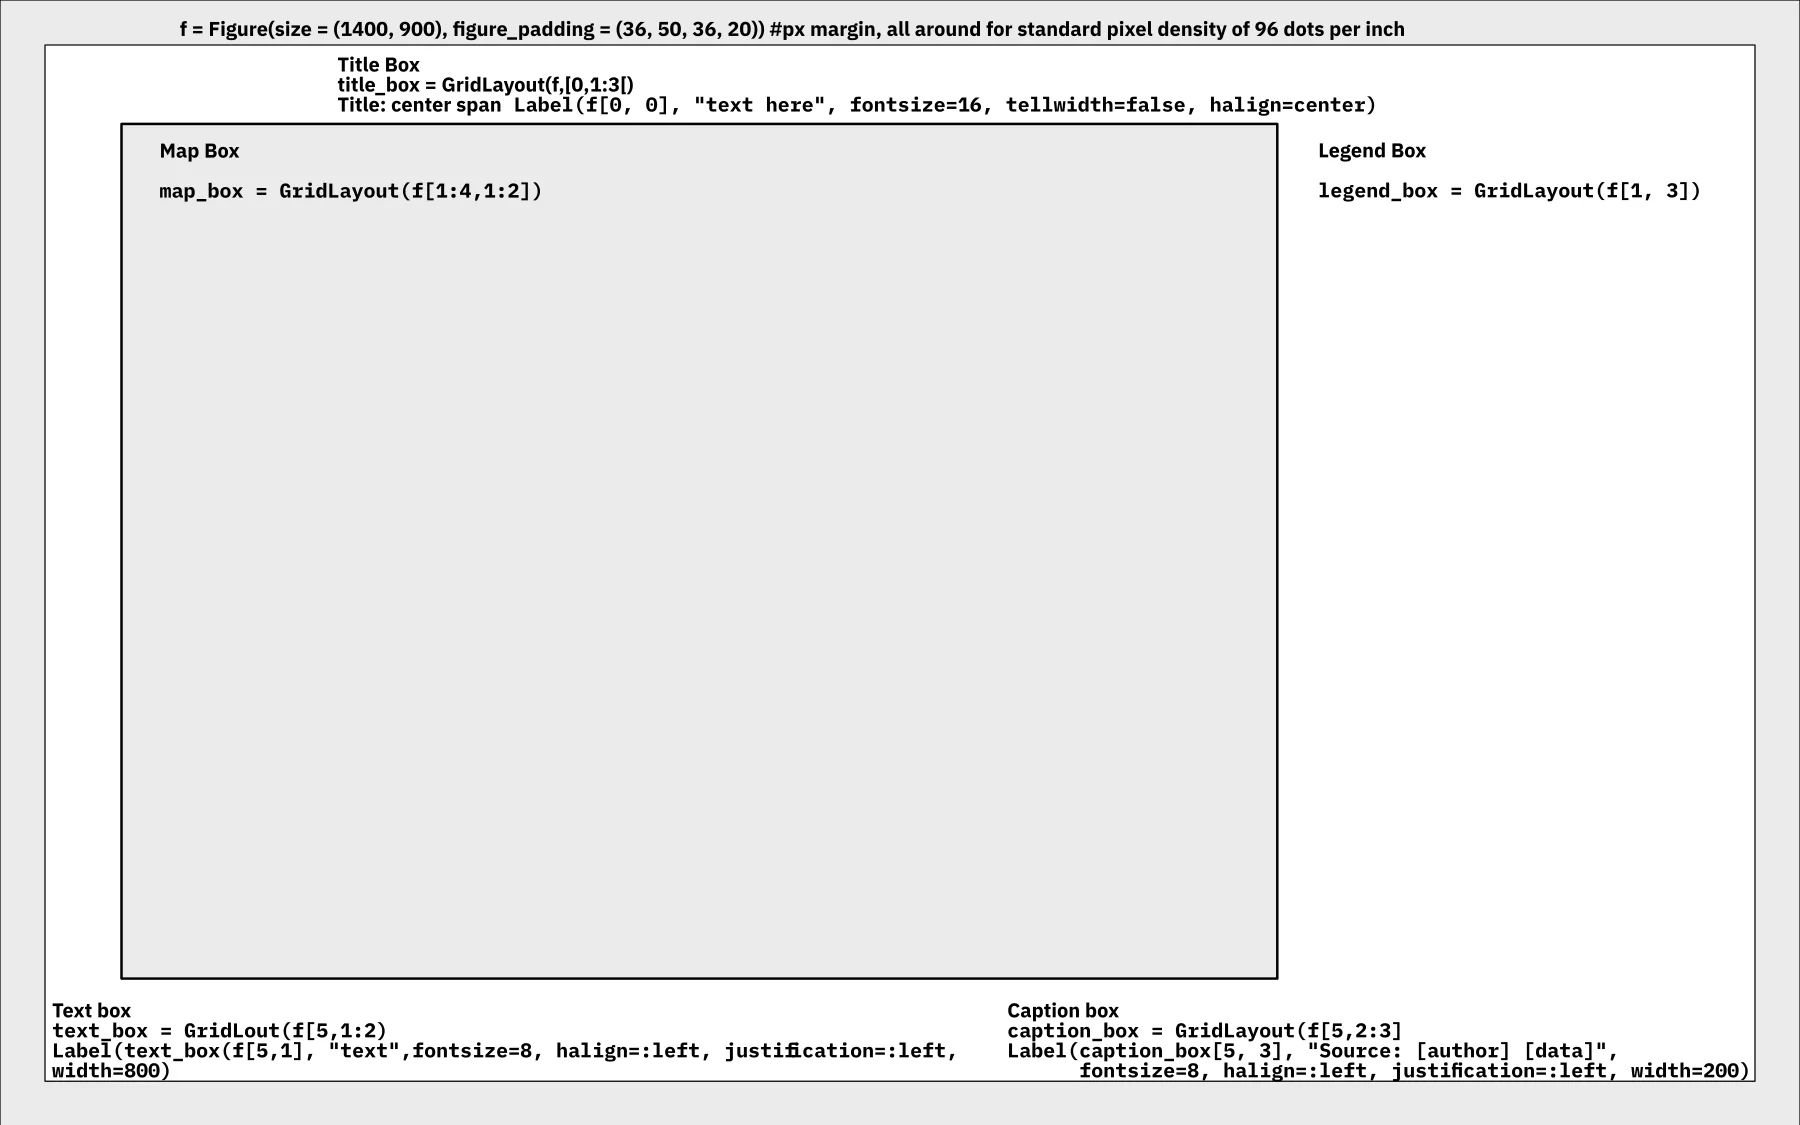
Layout ElementsOpen full size 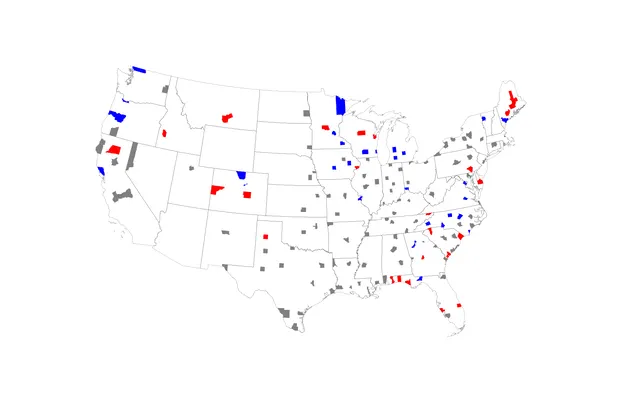
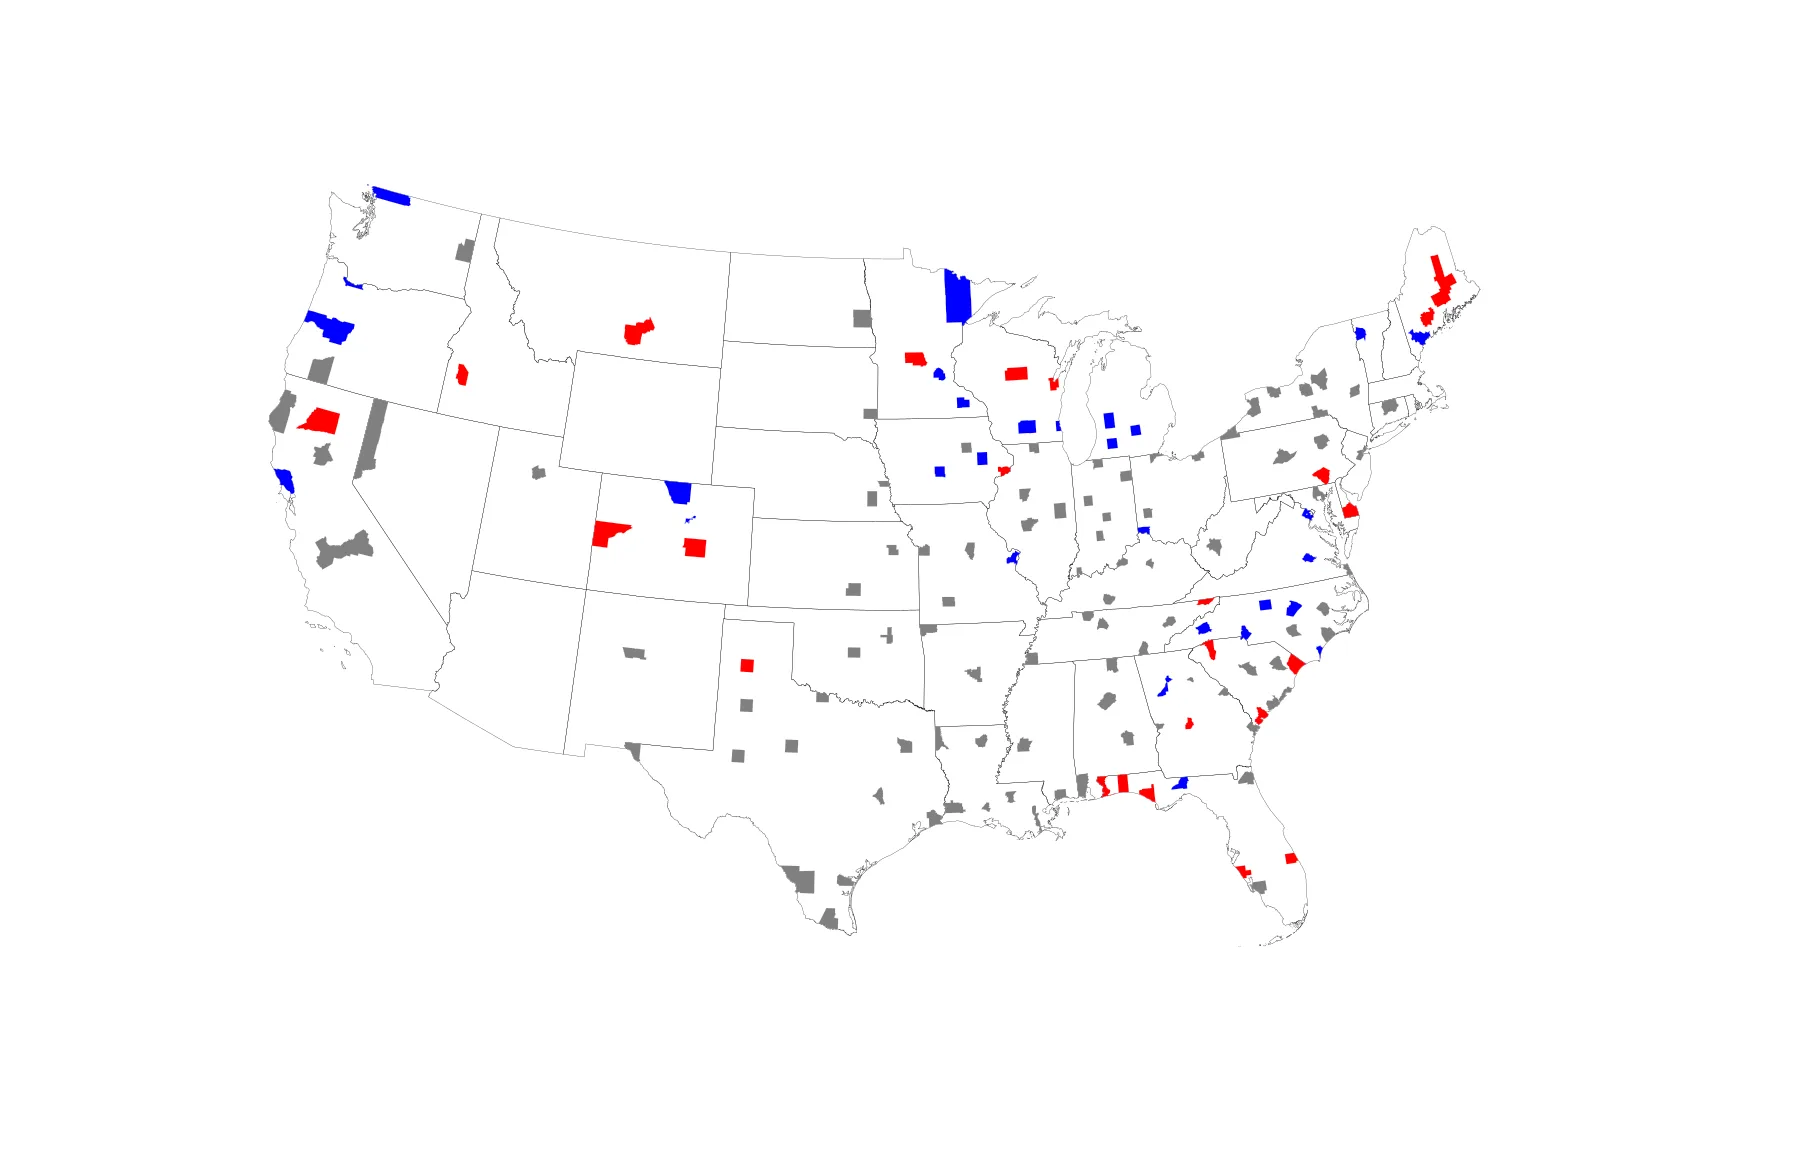
Data LayerOpen full size
Counts data
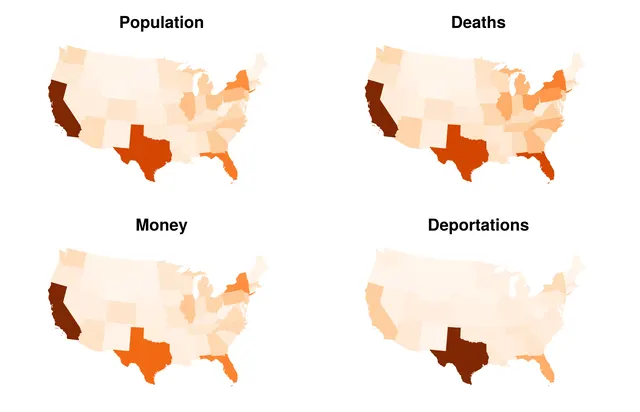
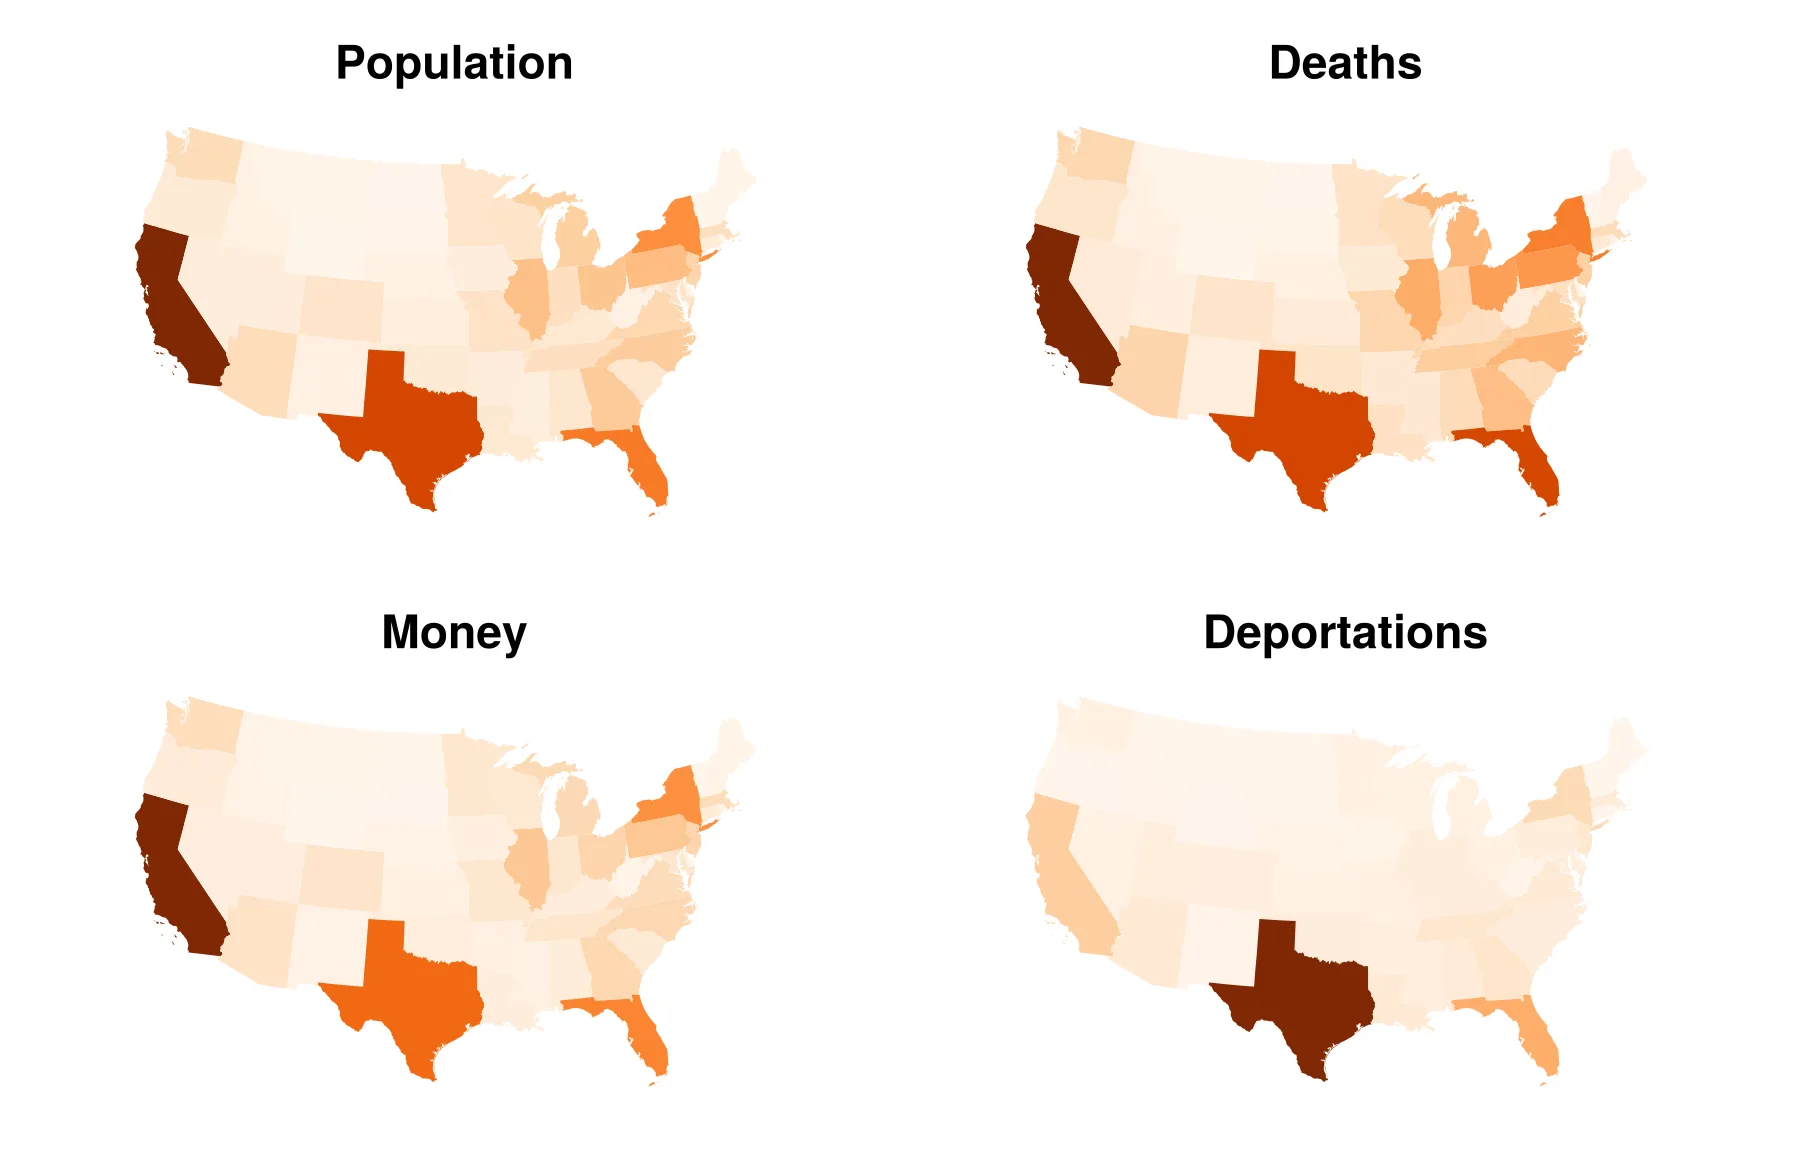
Population and Death Counts, GDP and DeportationsOpen full size 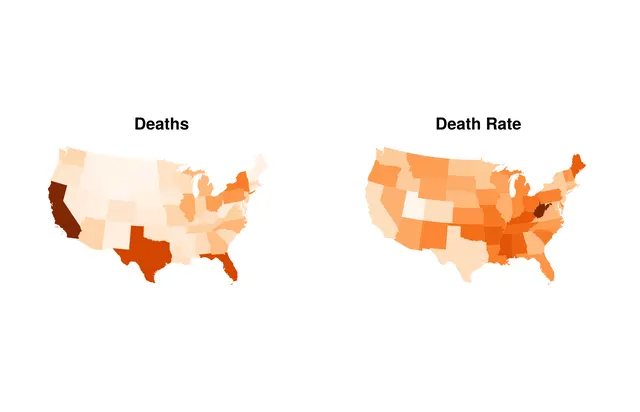
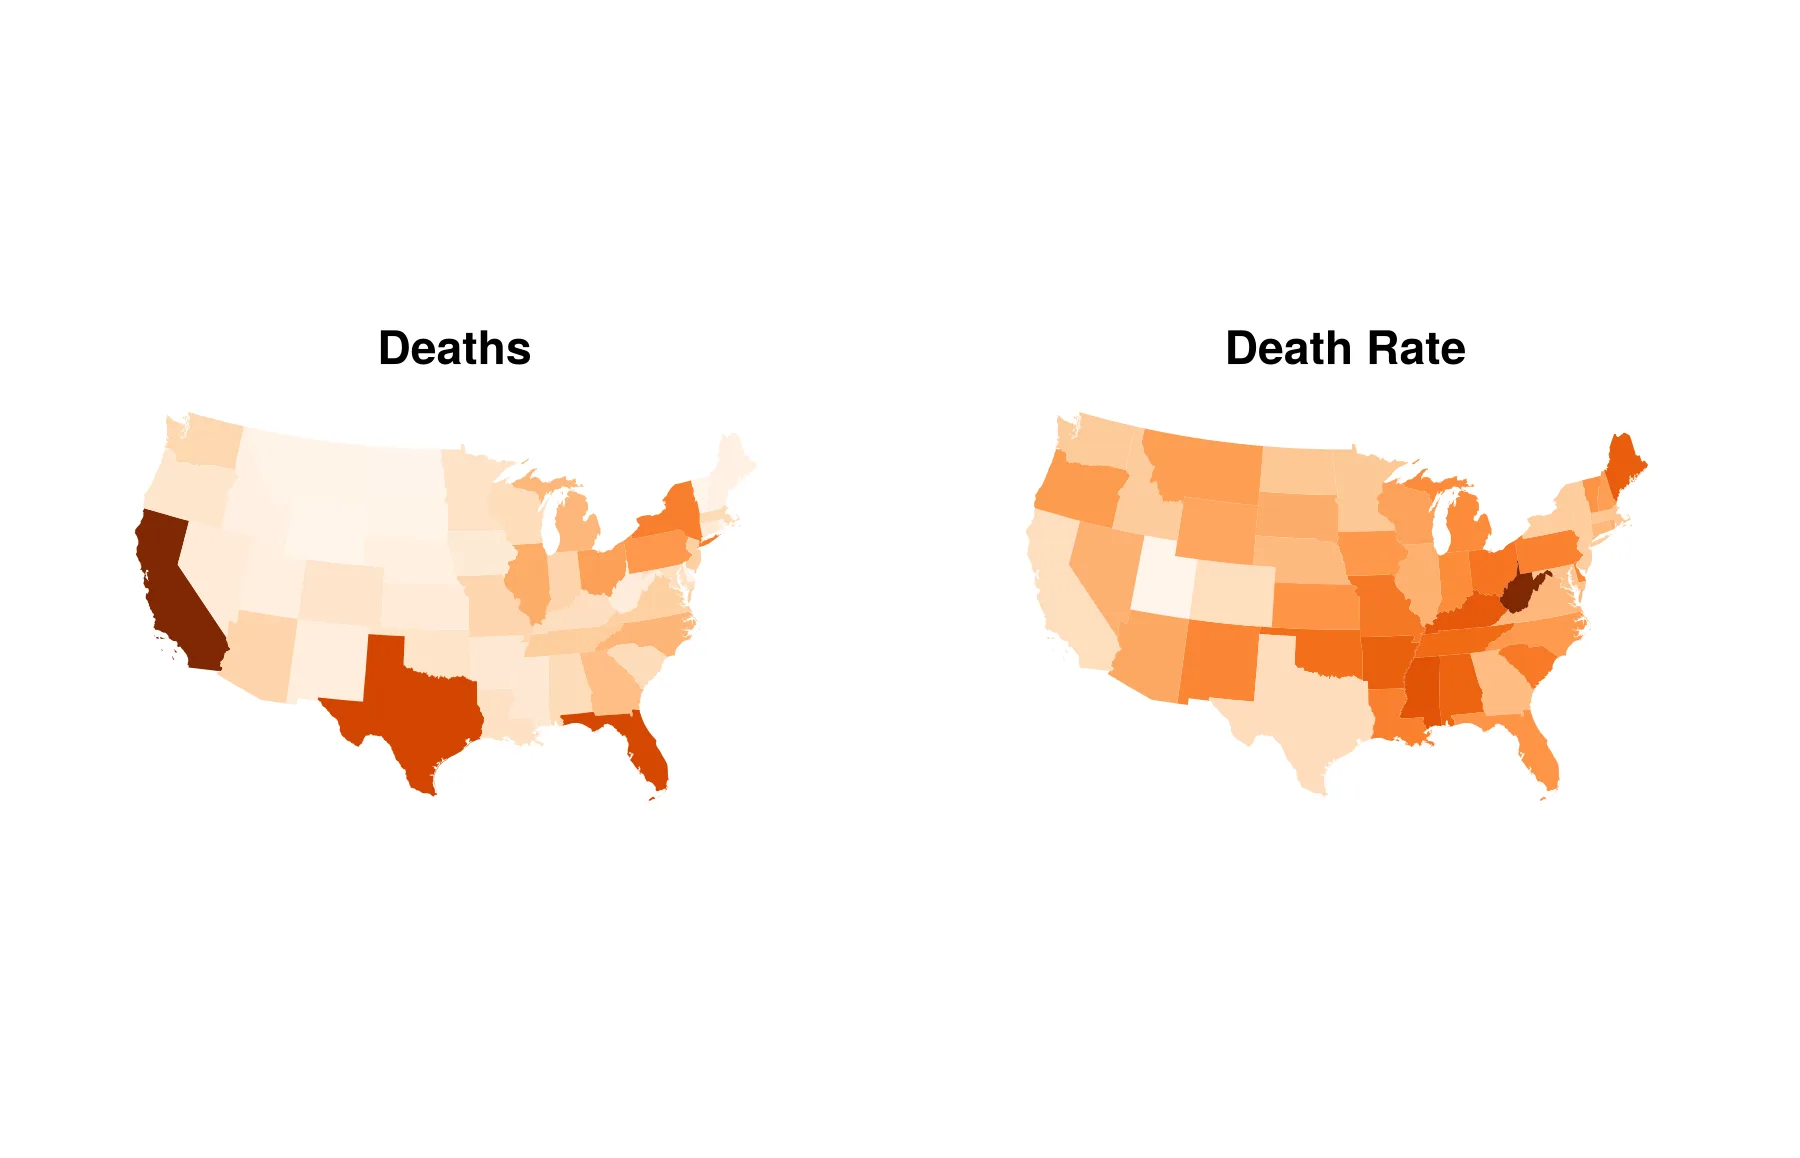
Death Counts Compared to Death RatesOpen full size 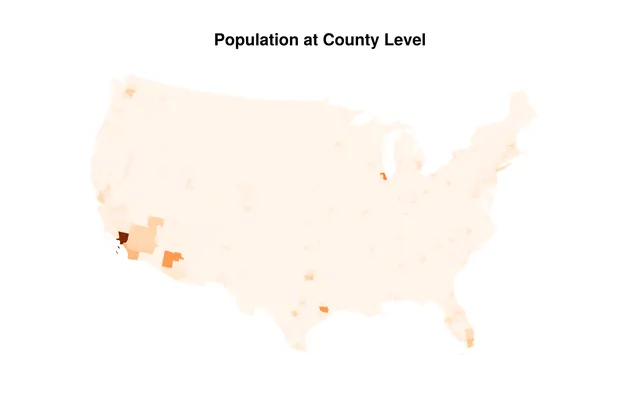
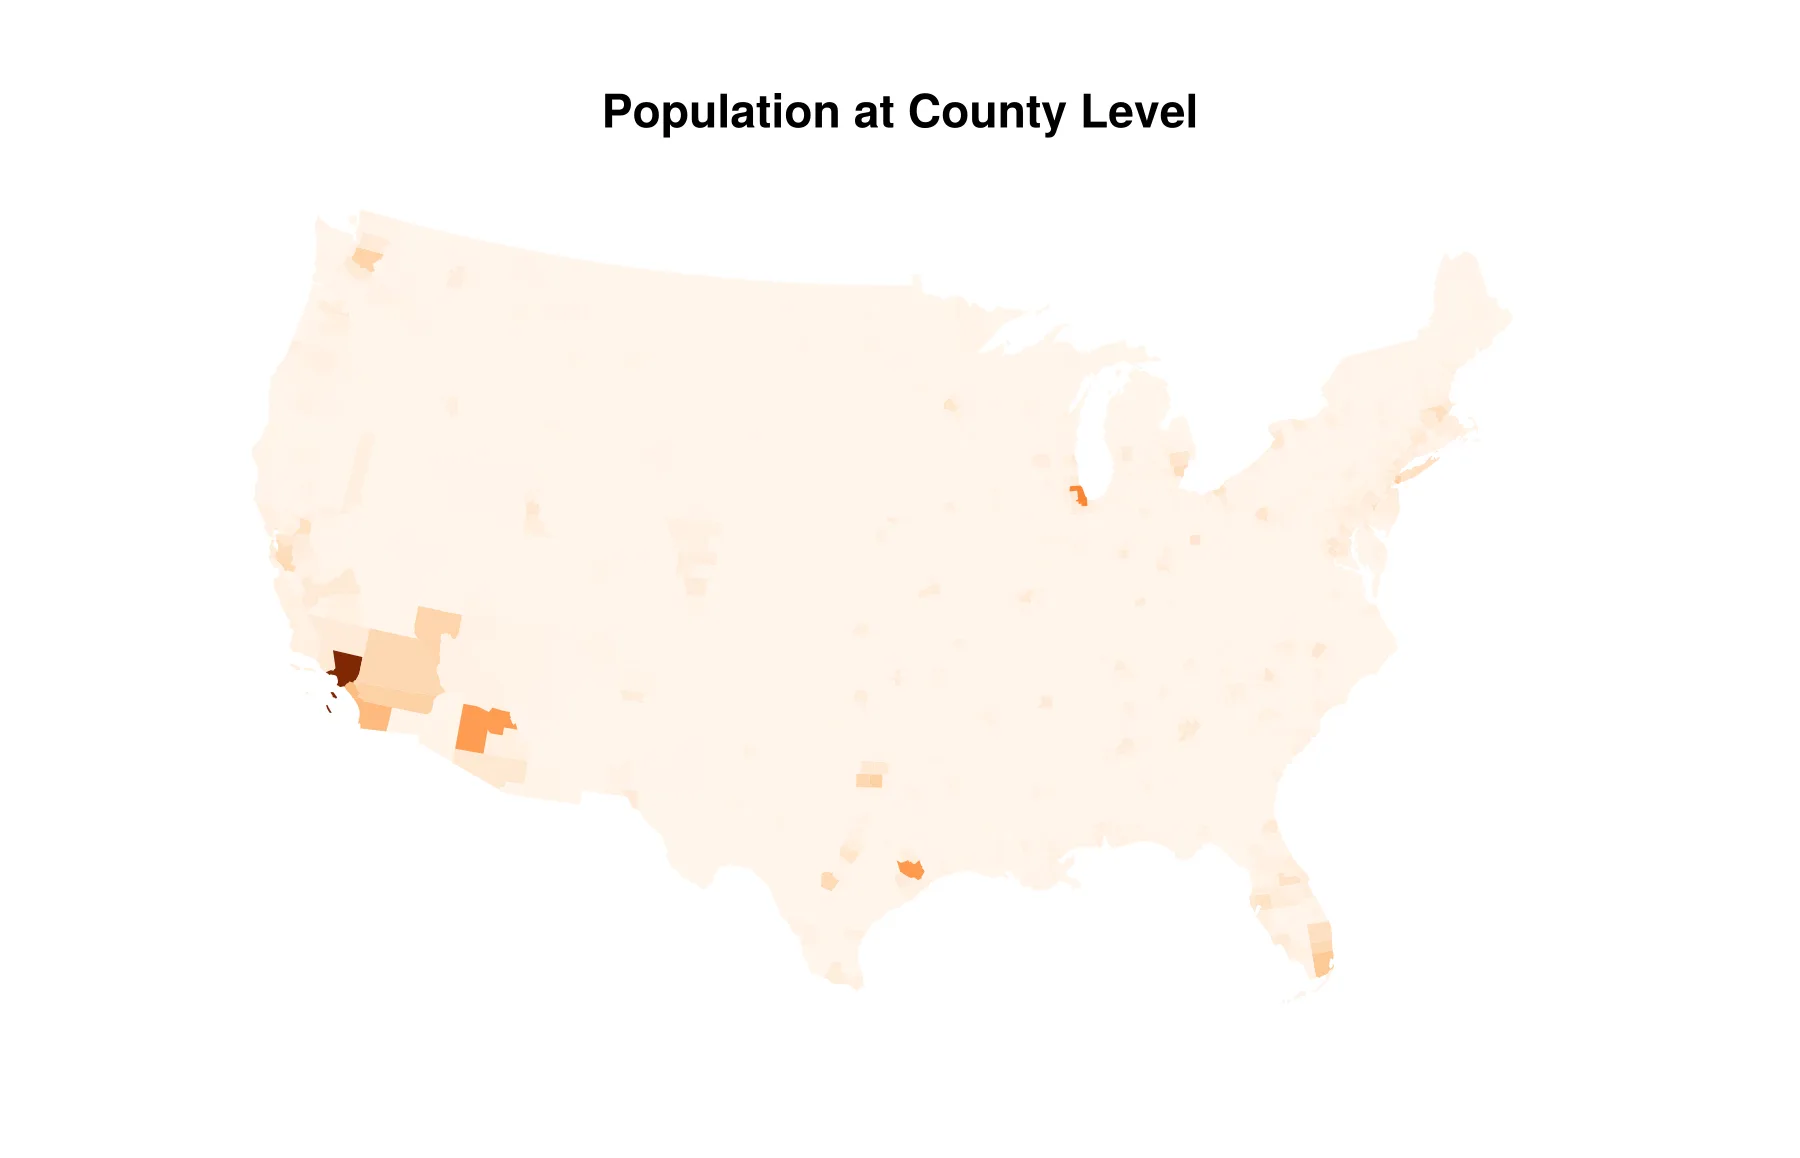
Raw Population at County ScaleOpen full size 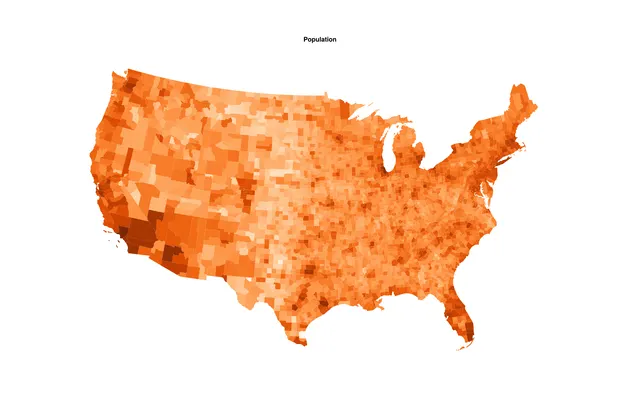
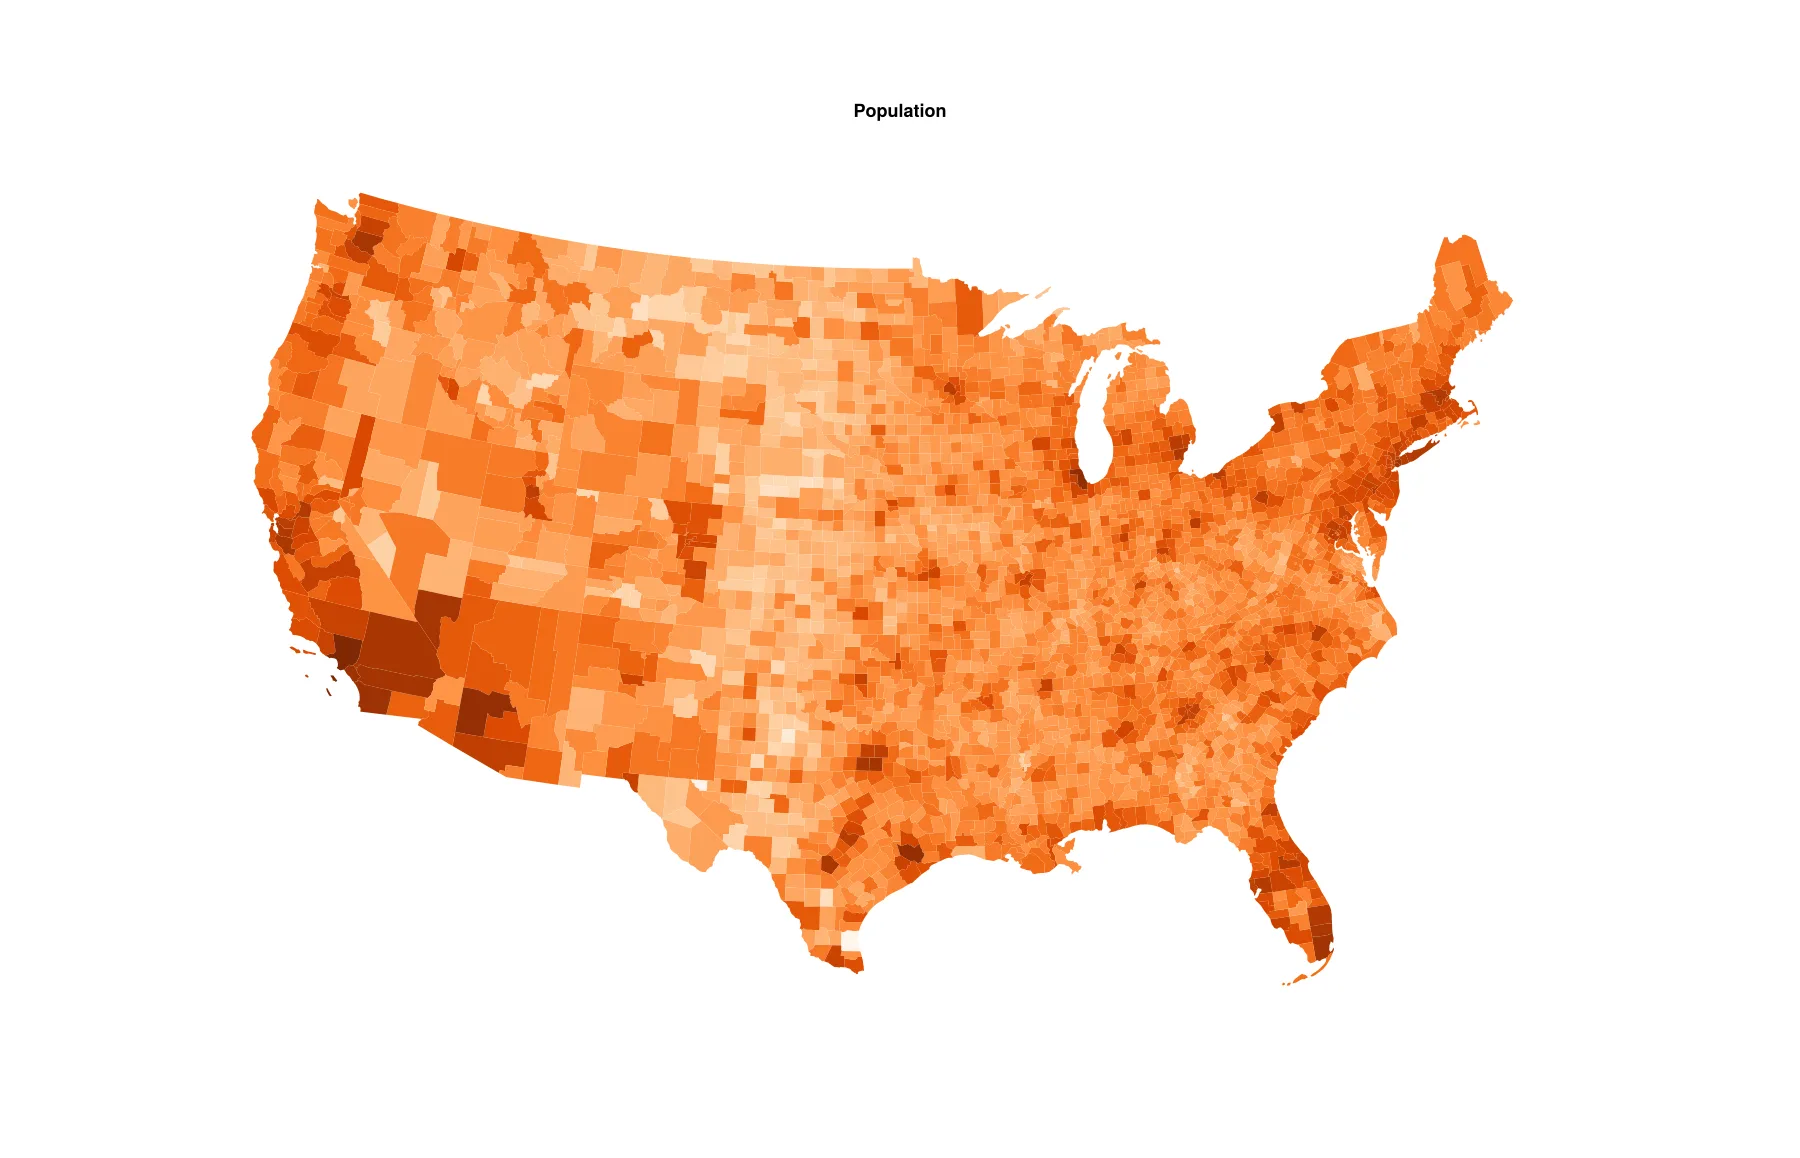
Logarithmic Transformation of PopulationOpen full size 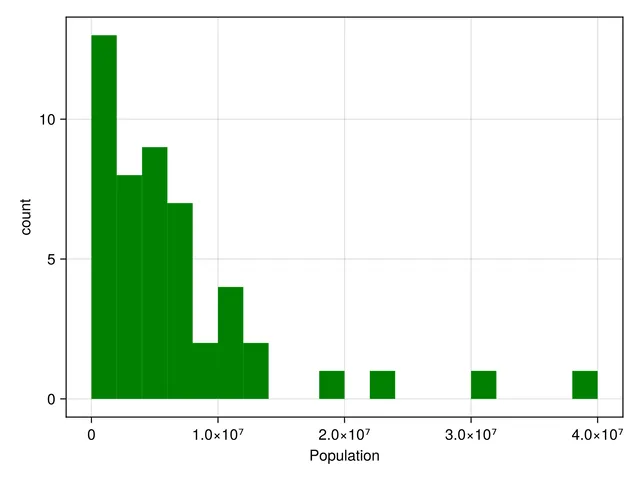
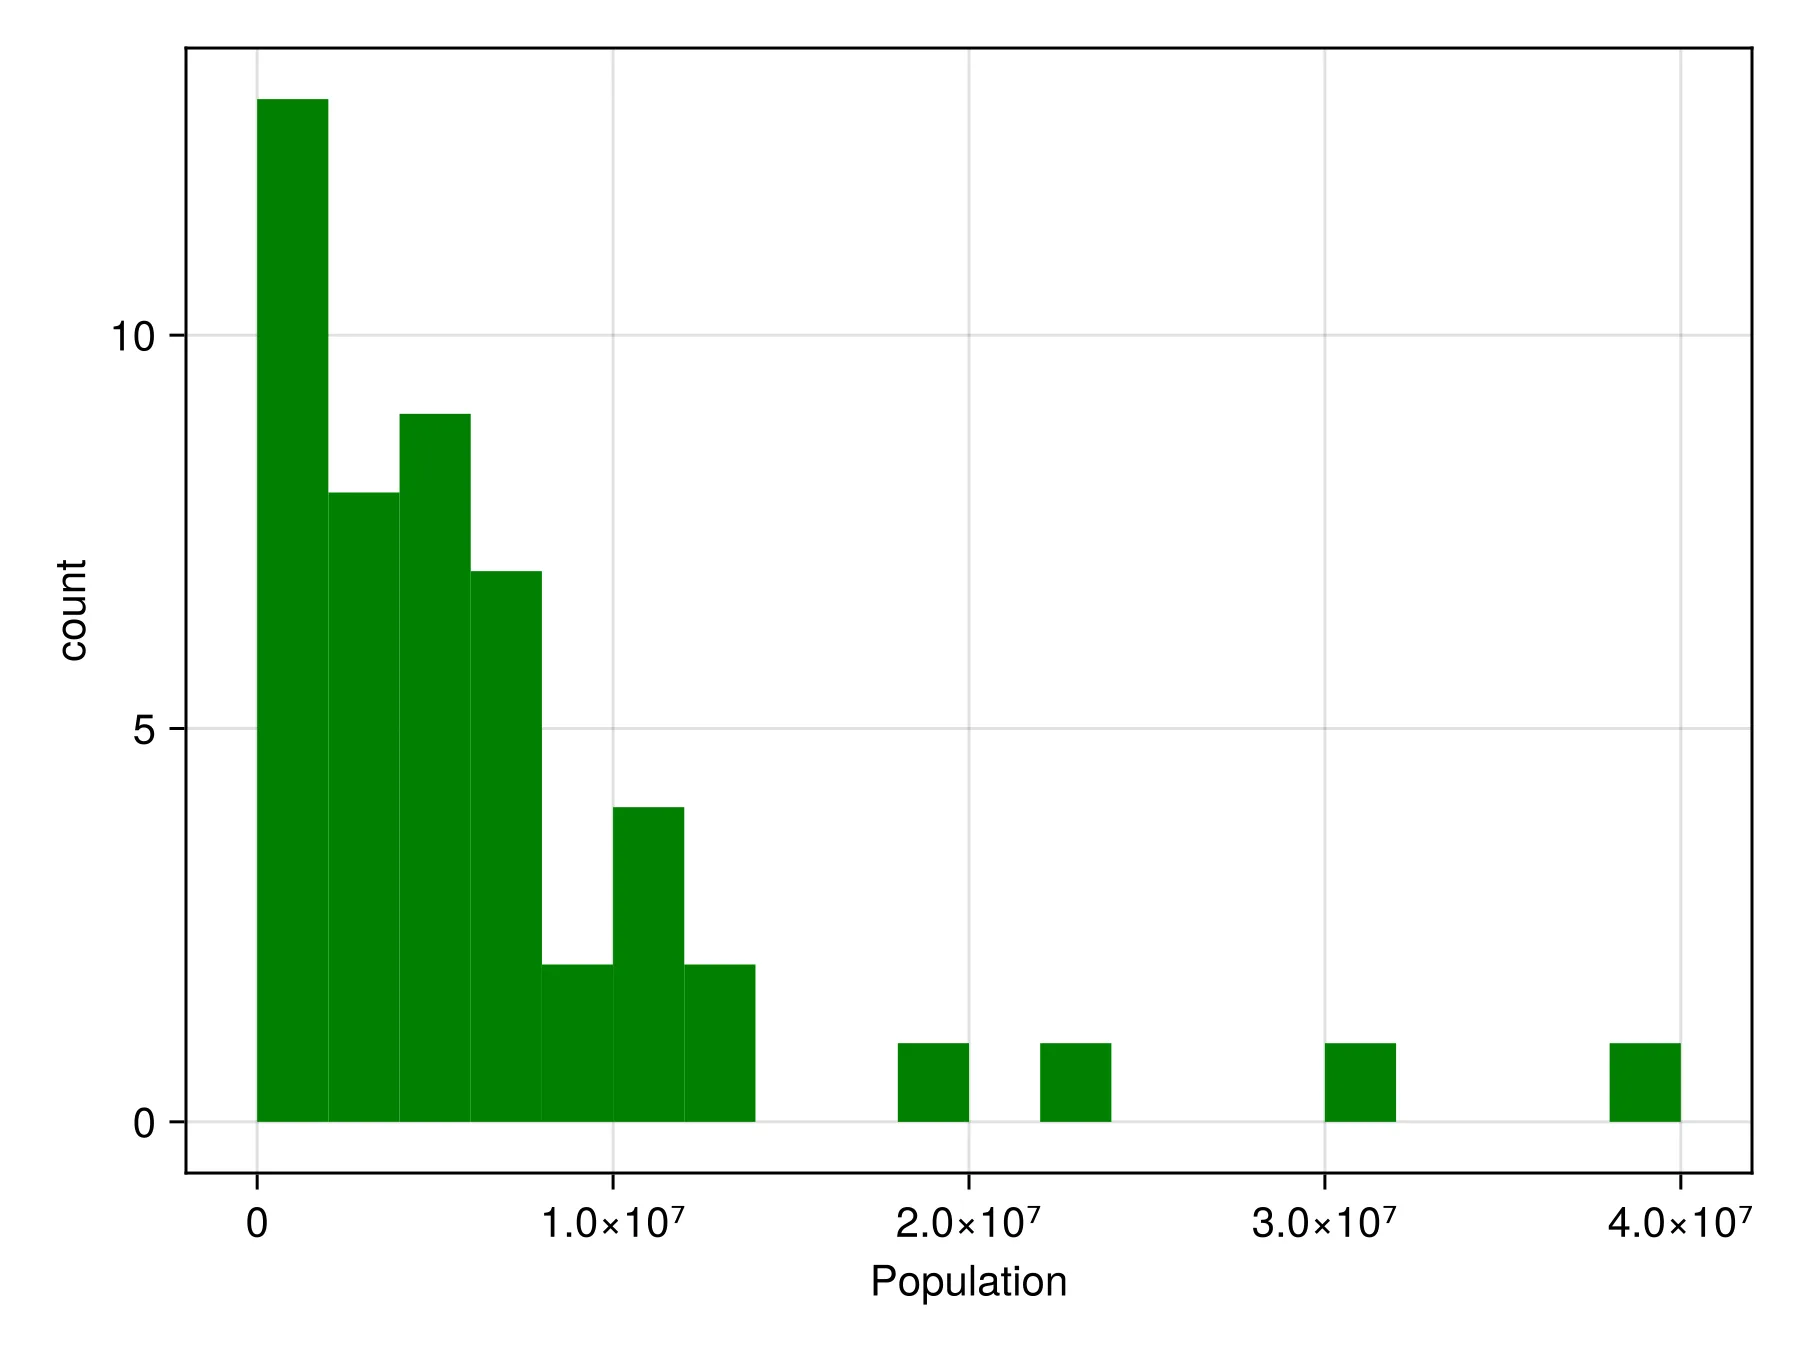
Population Histogram of 2023 Estimated US PopulationOpen full size 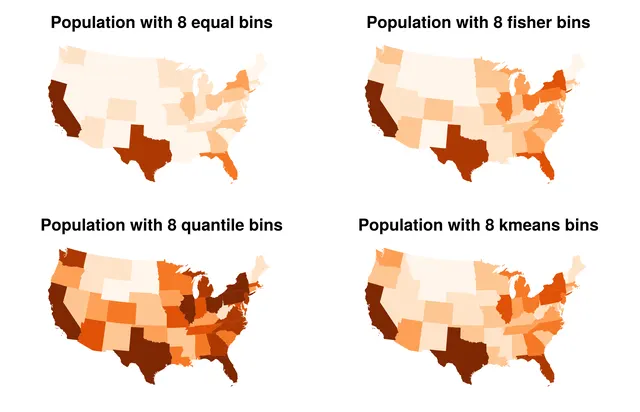
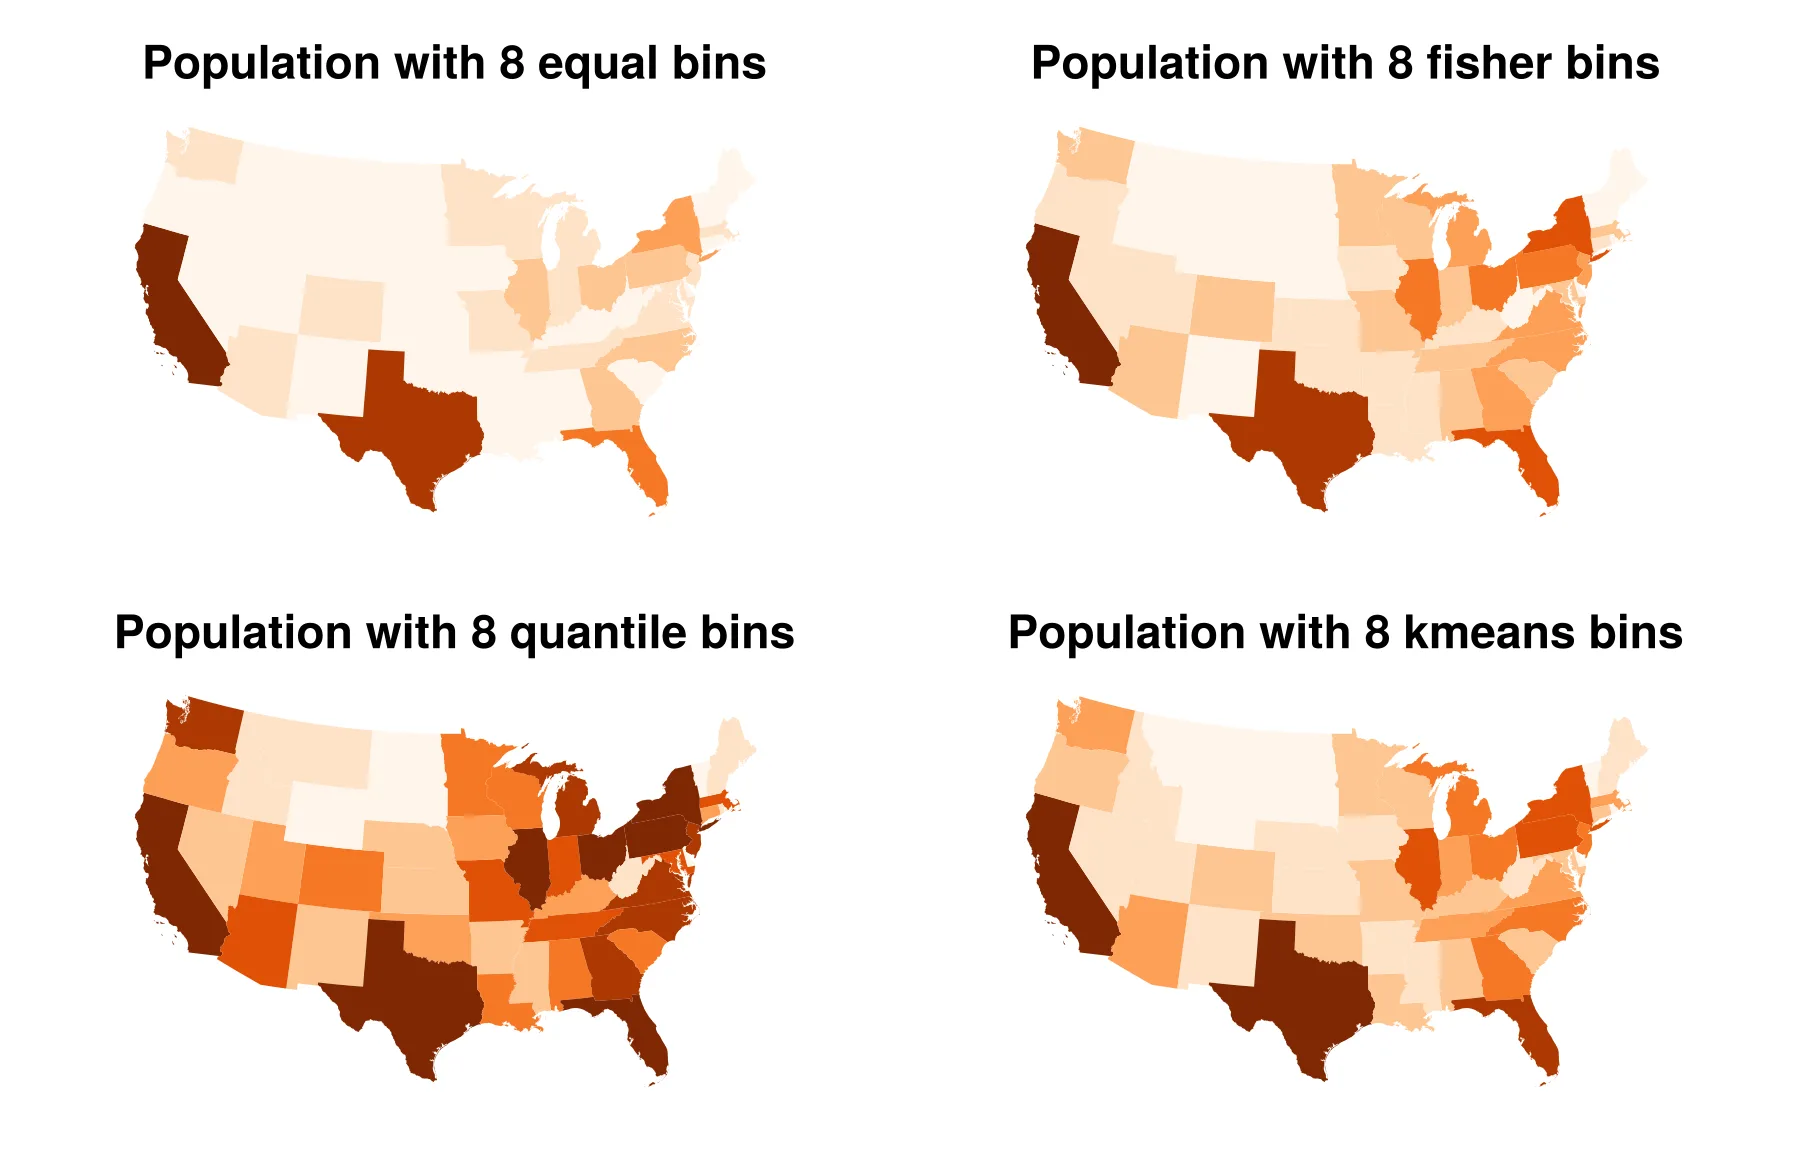
Application of Four Binning AlgorithmsOpen full size 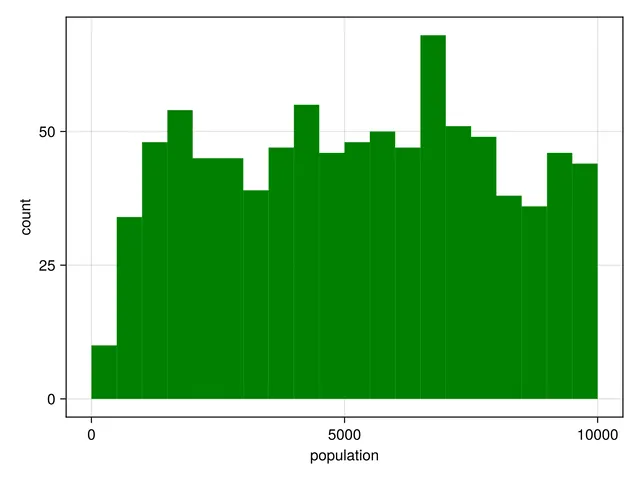
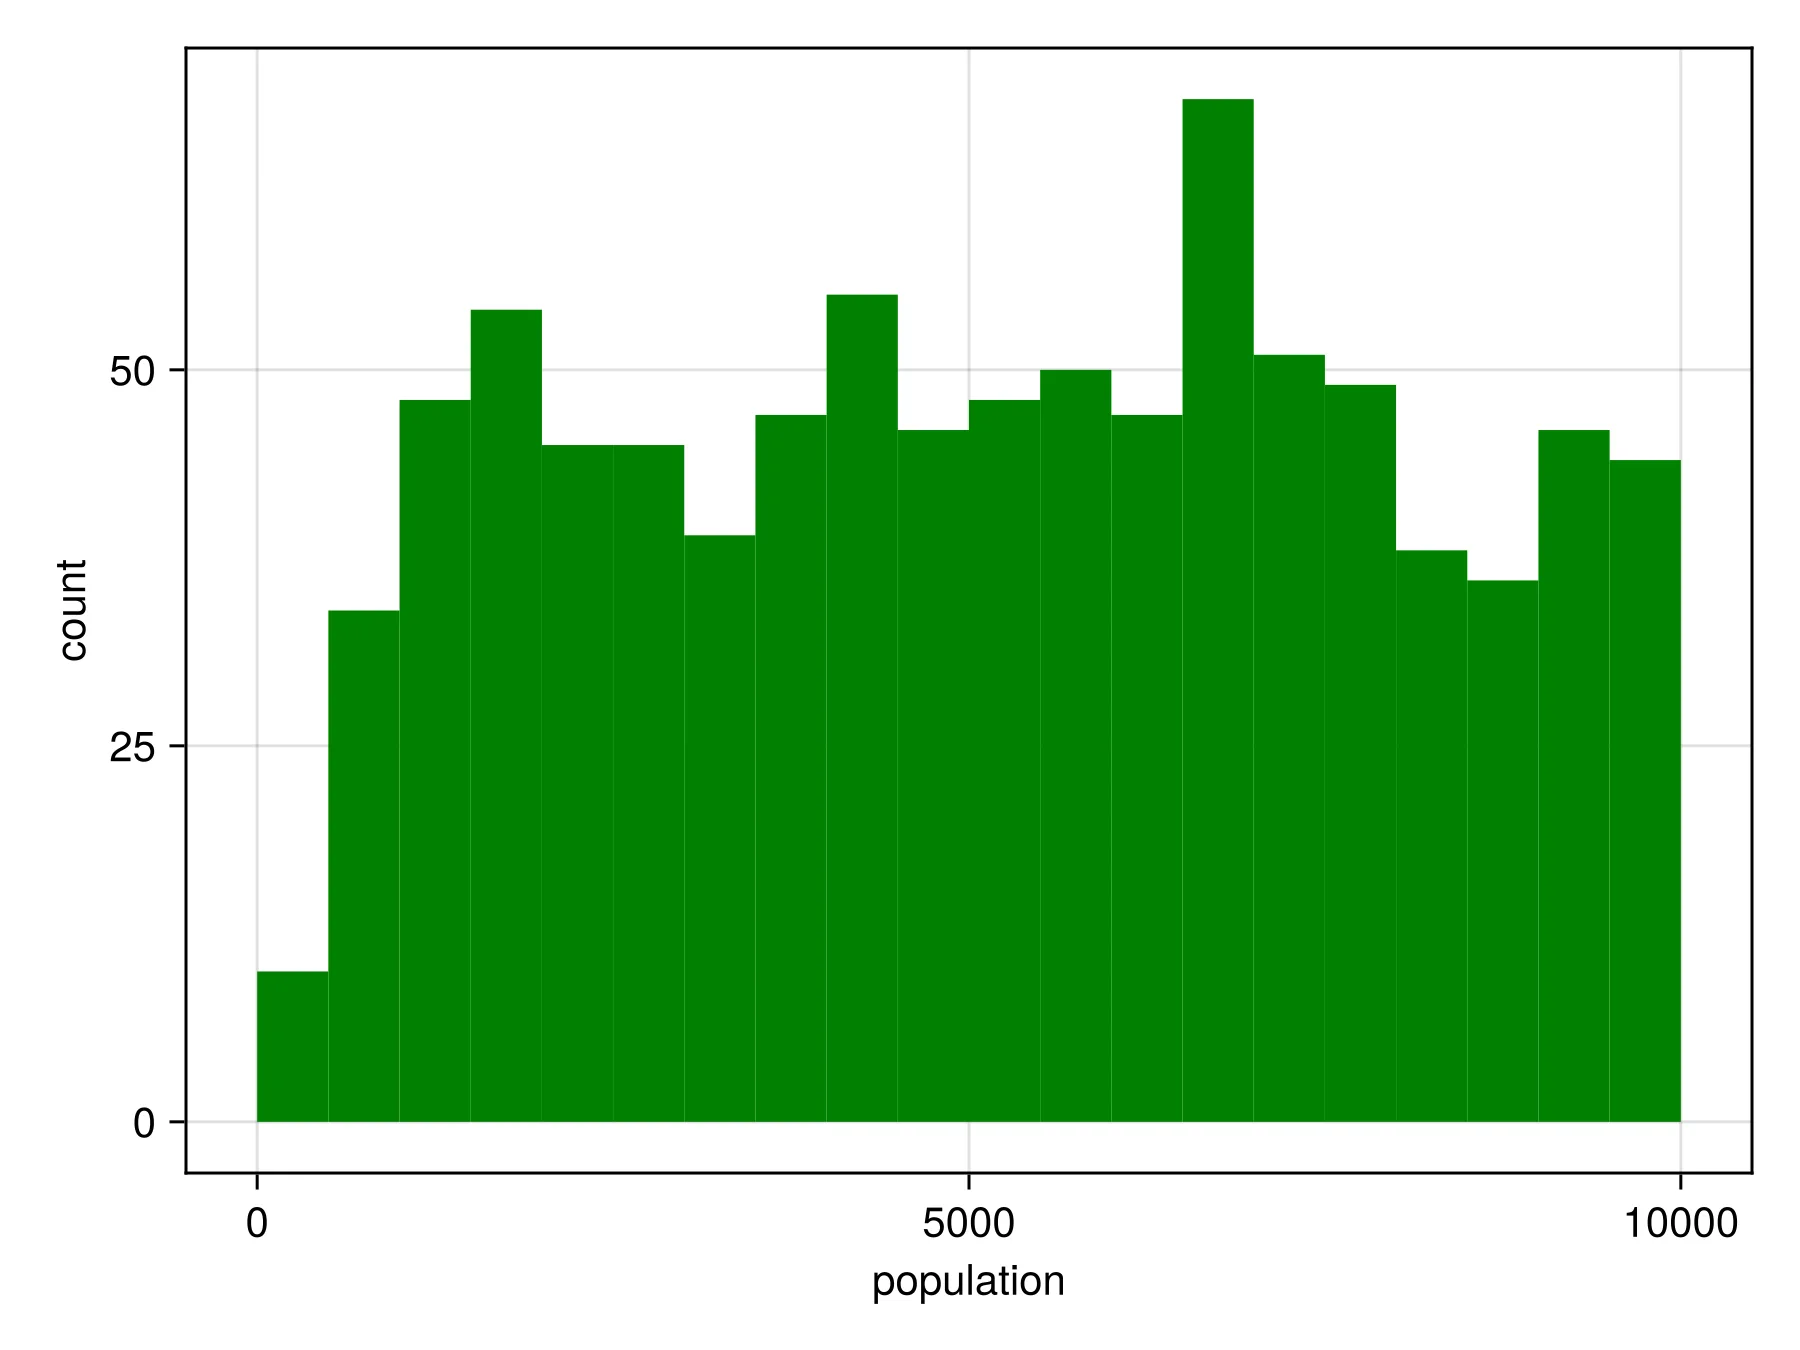
Sizes of Counties under 10,000 PopulationOpen full size 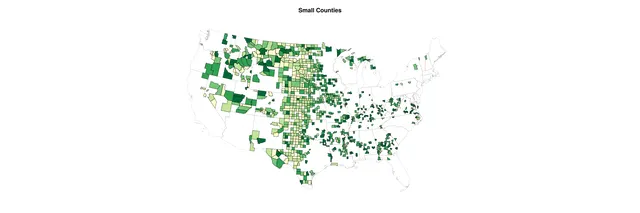
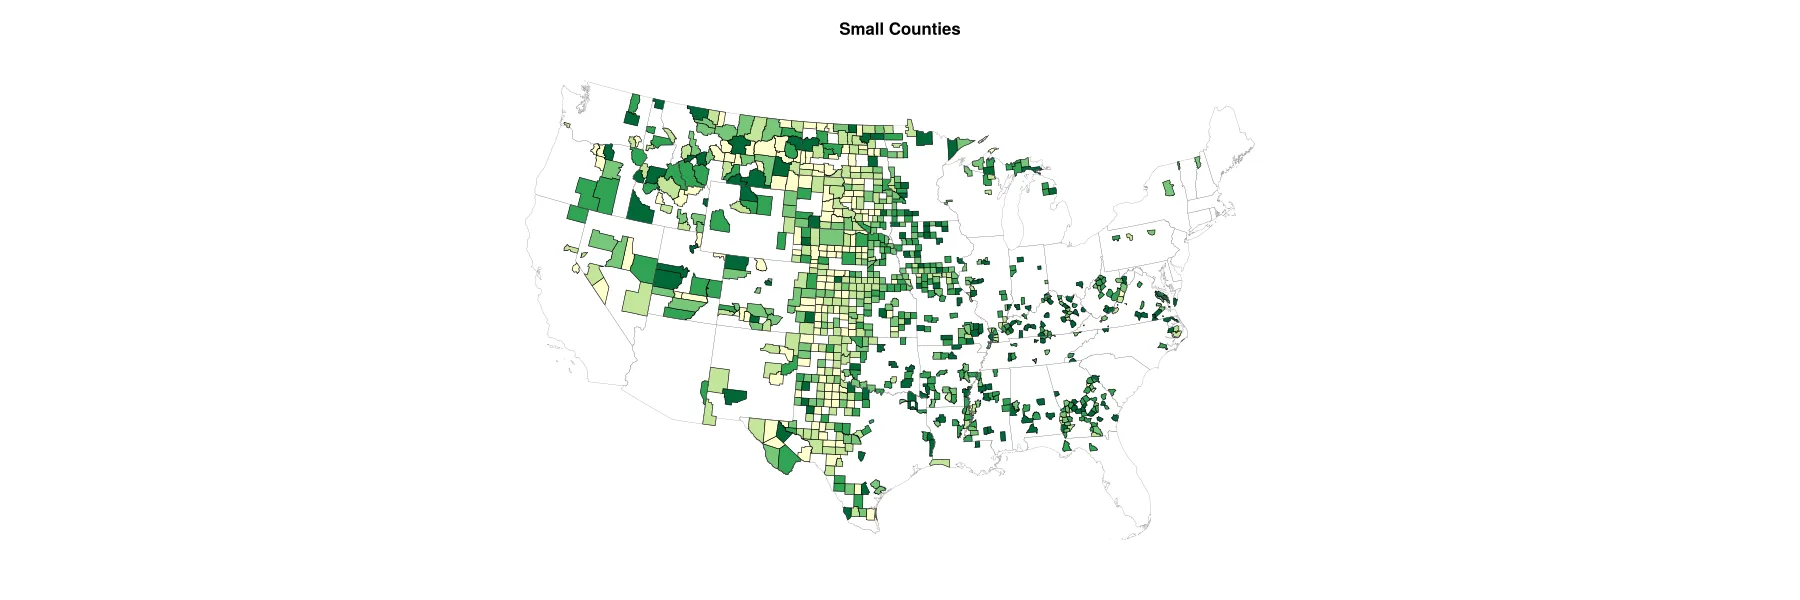
Small Counties with Equal Interval ColoringOpen full size 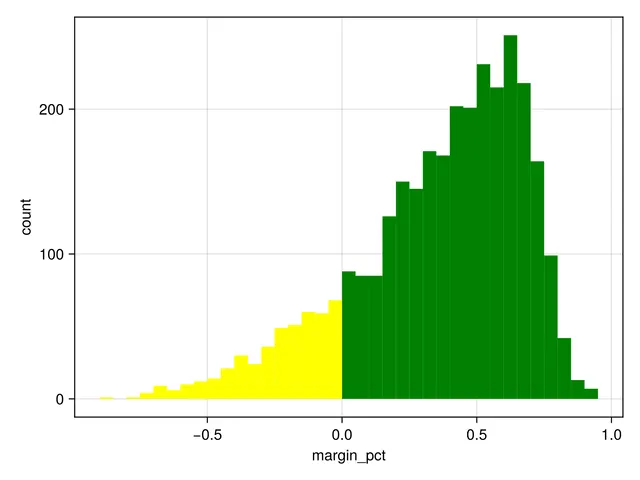
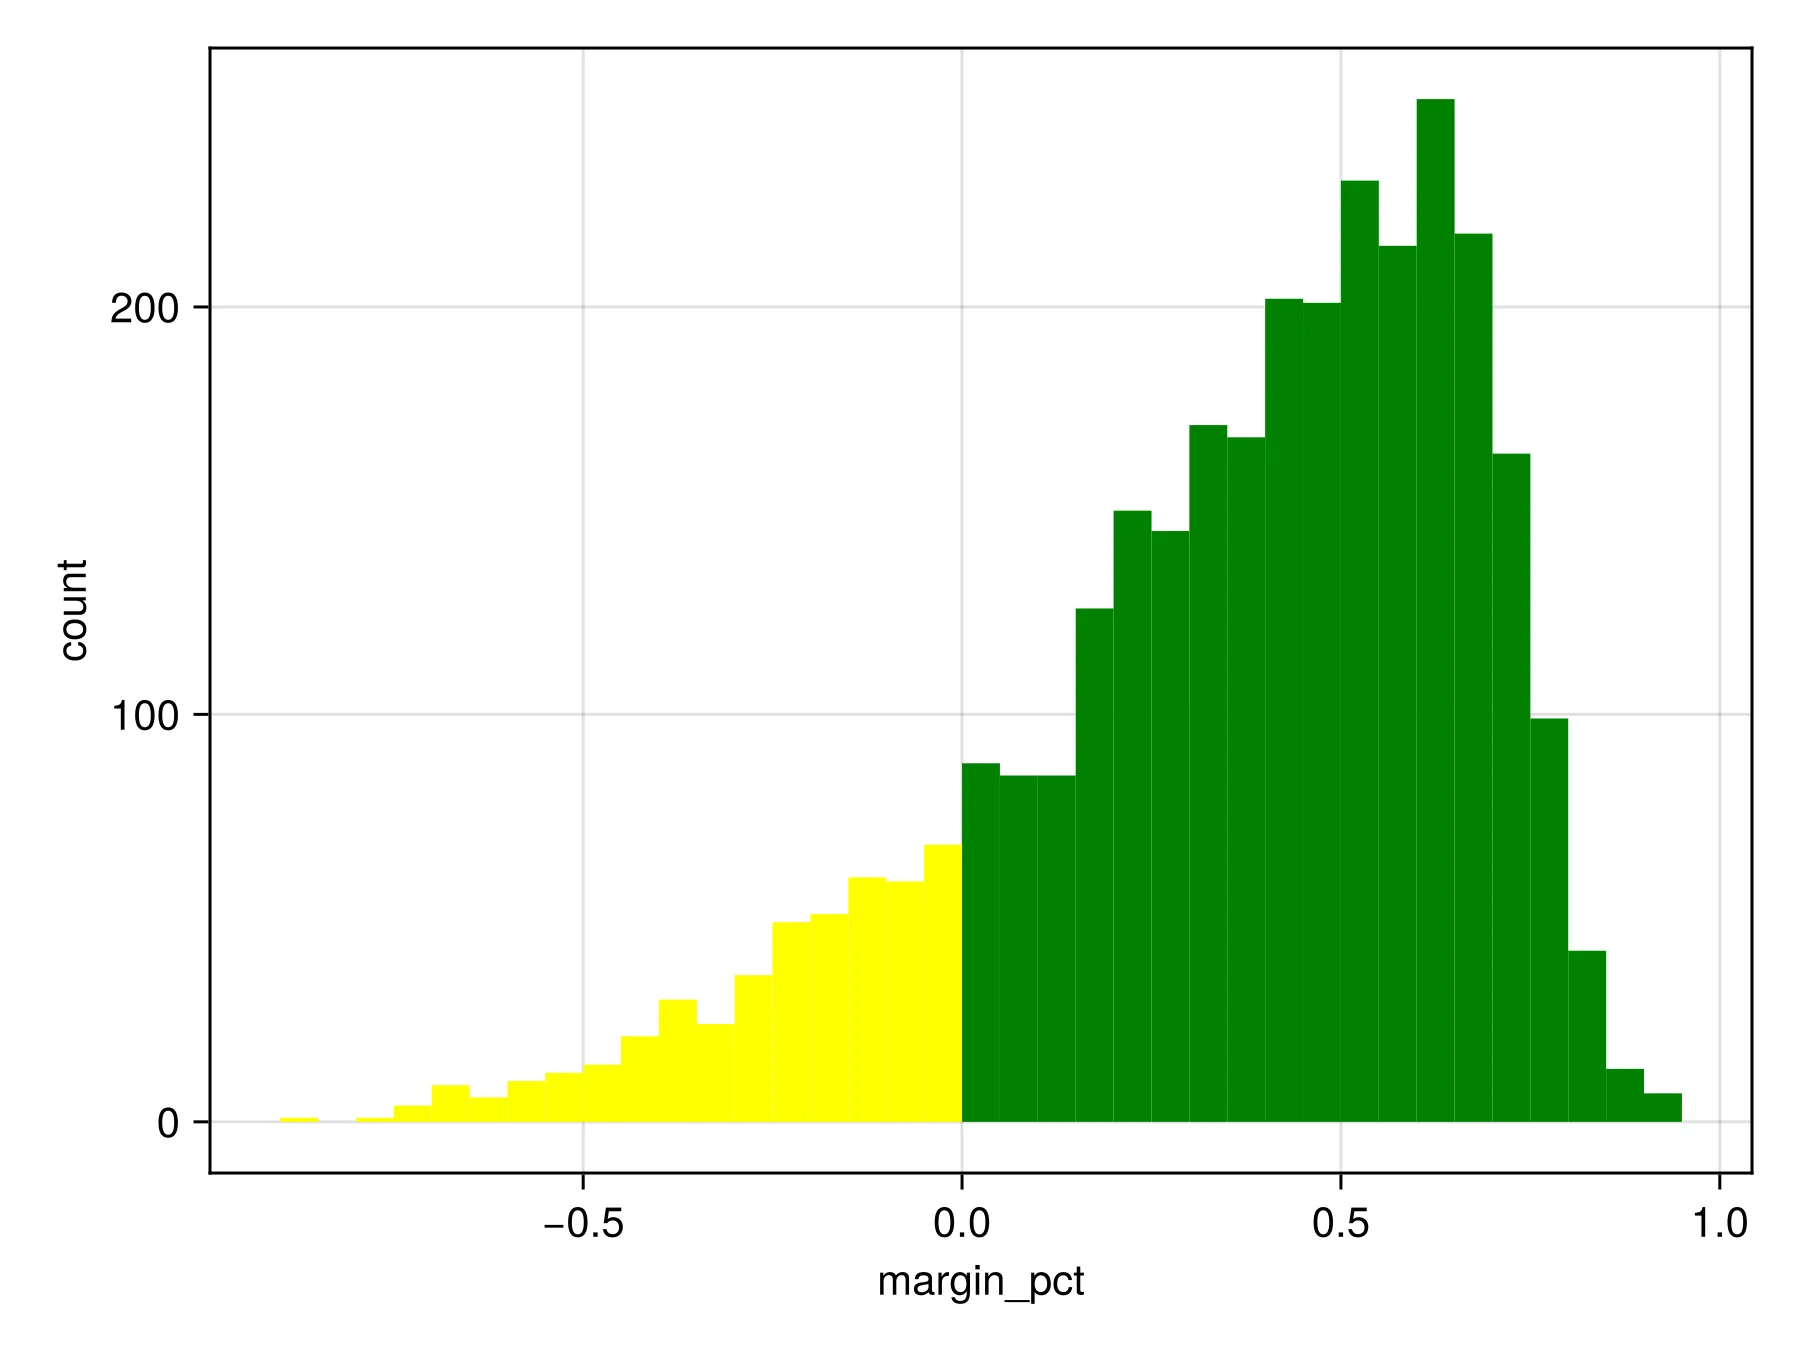
Distributions of Small County MarginsOpen full size 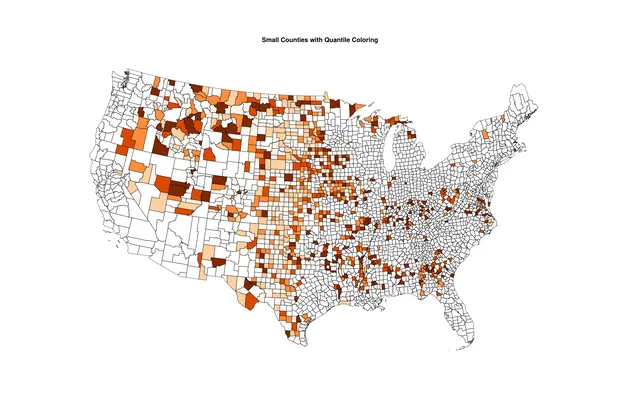
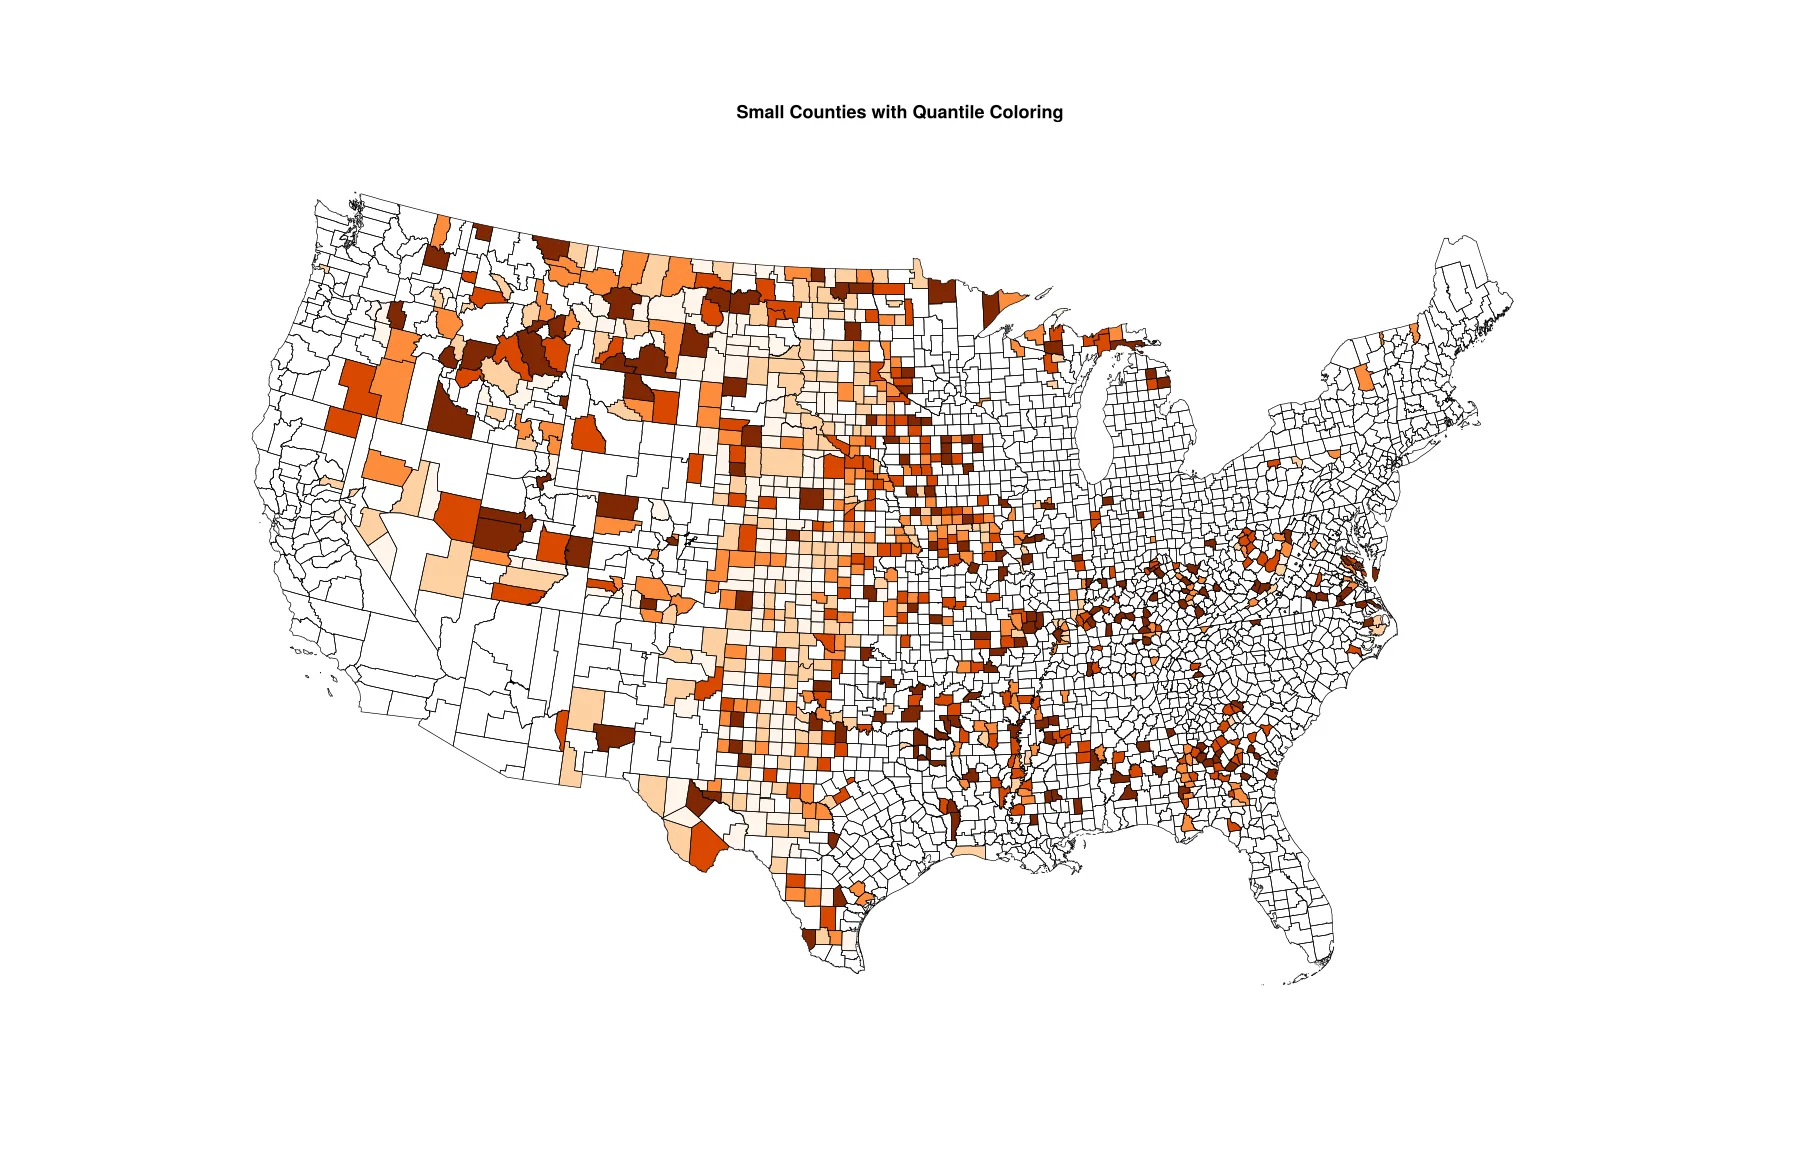
Small Counties with Quantile ColoringOpen full size 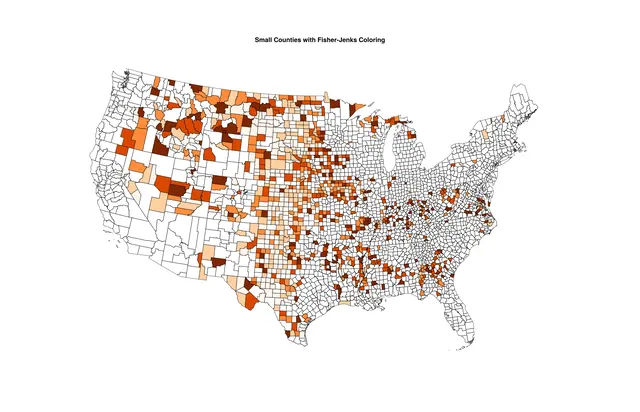
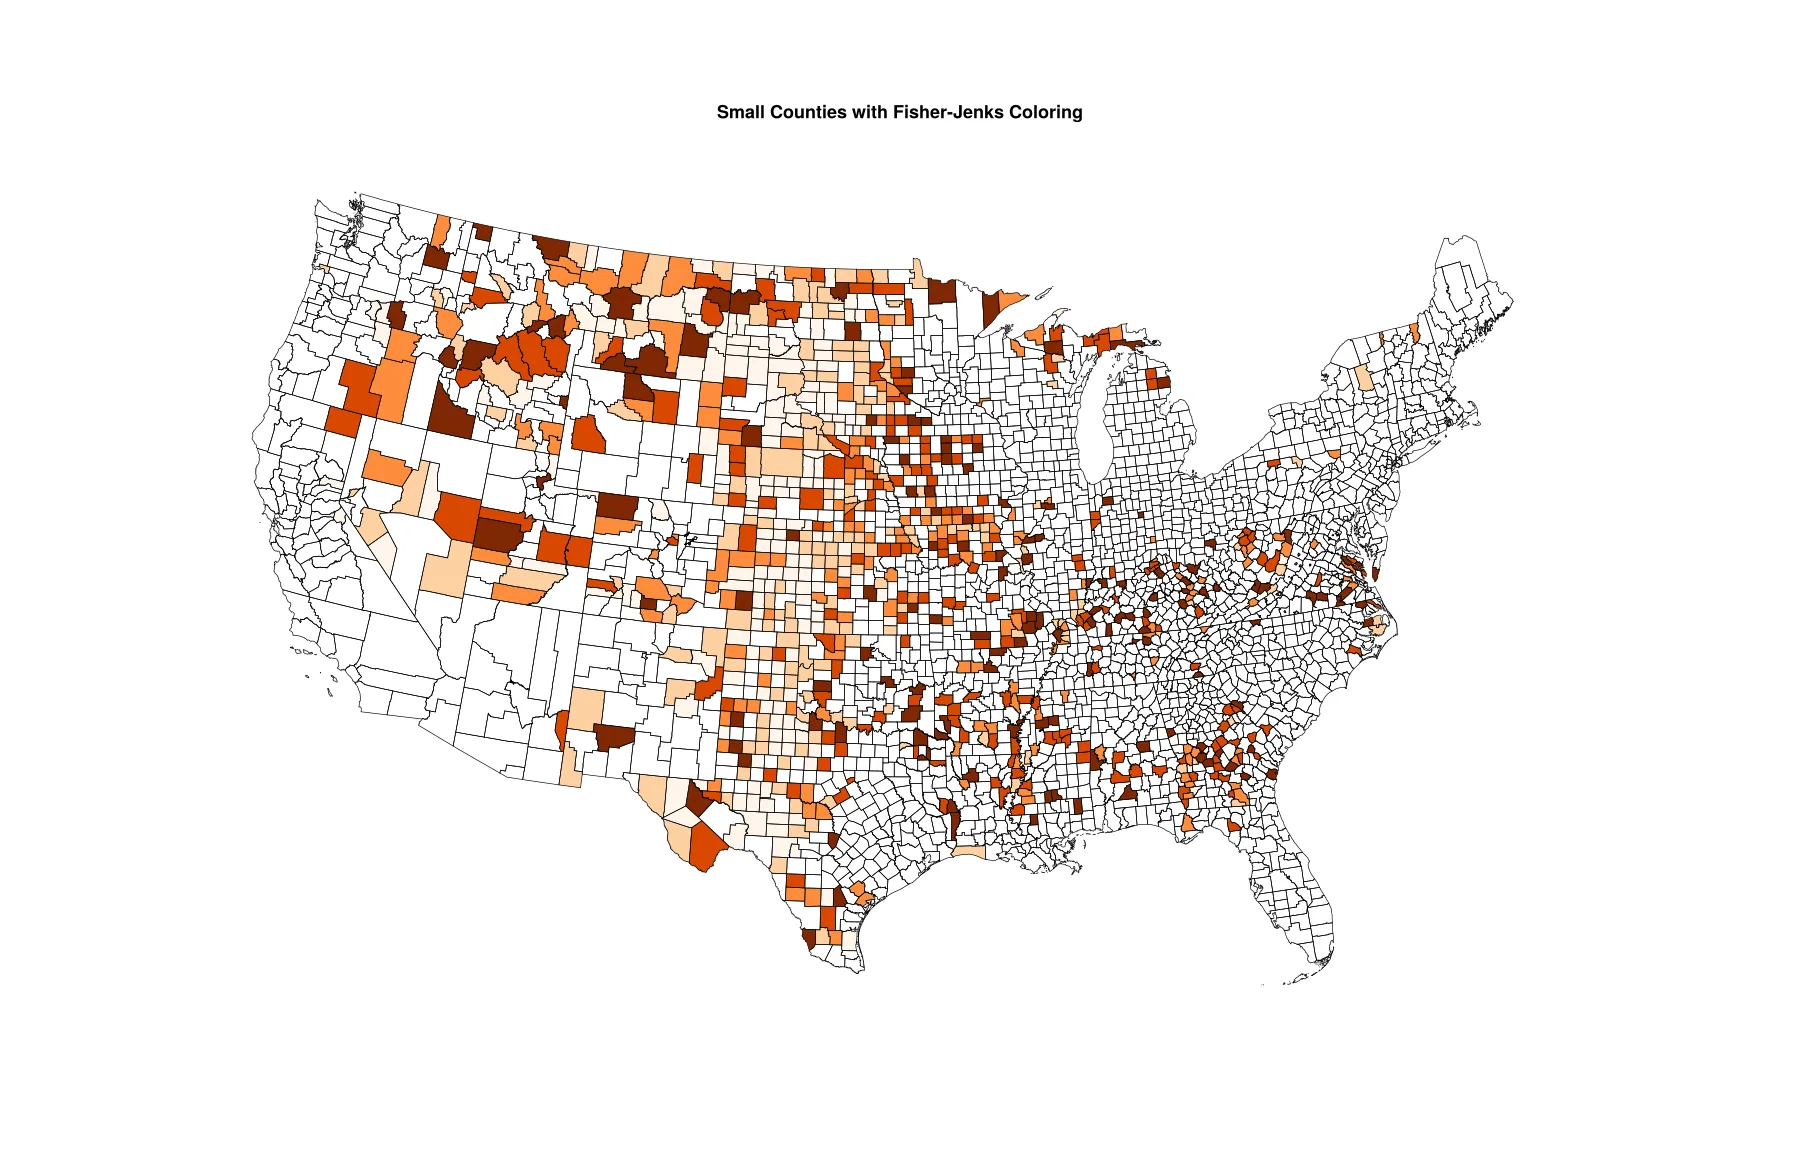
Small Counties with Fisher-Jenks ColoringOpen full size
When color is not an option
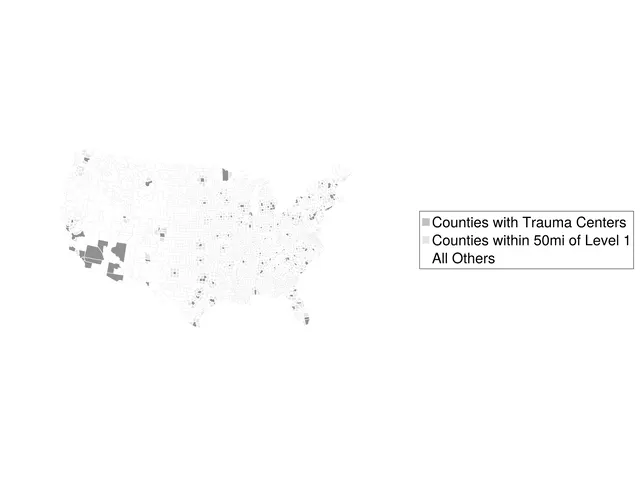
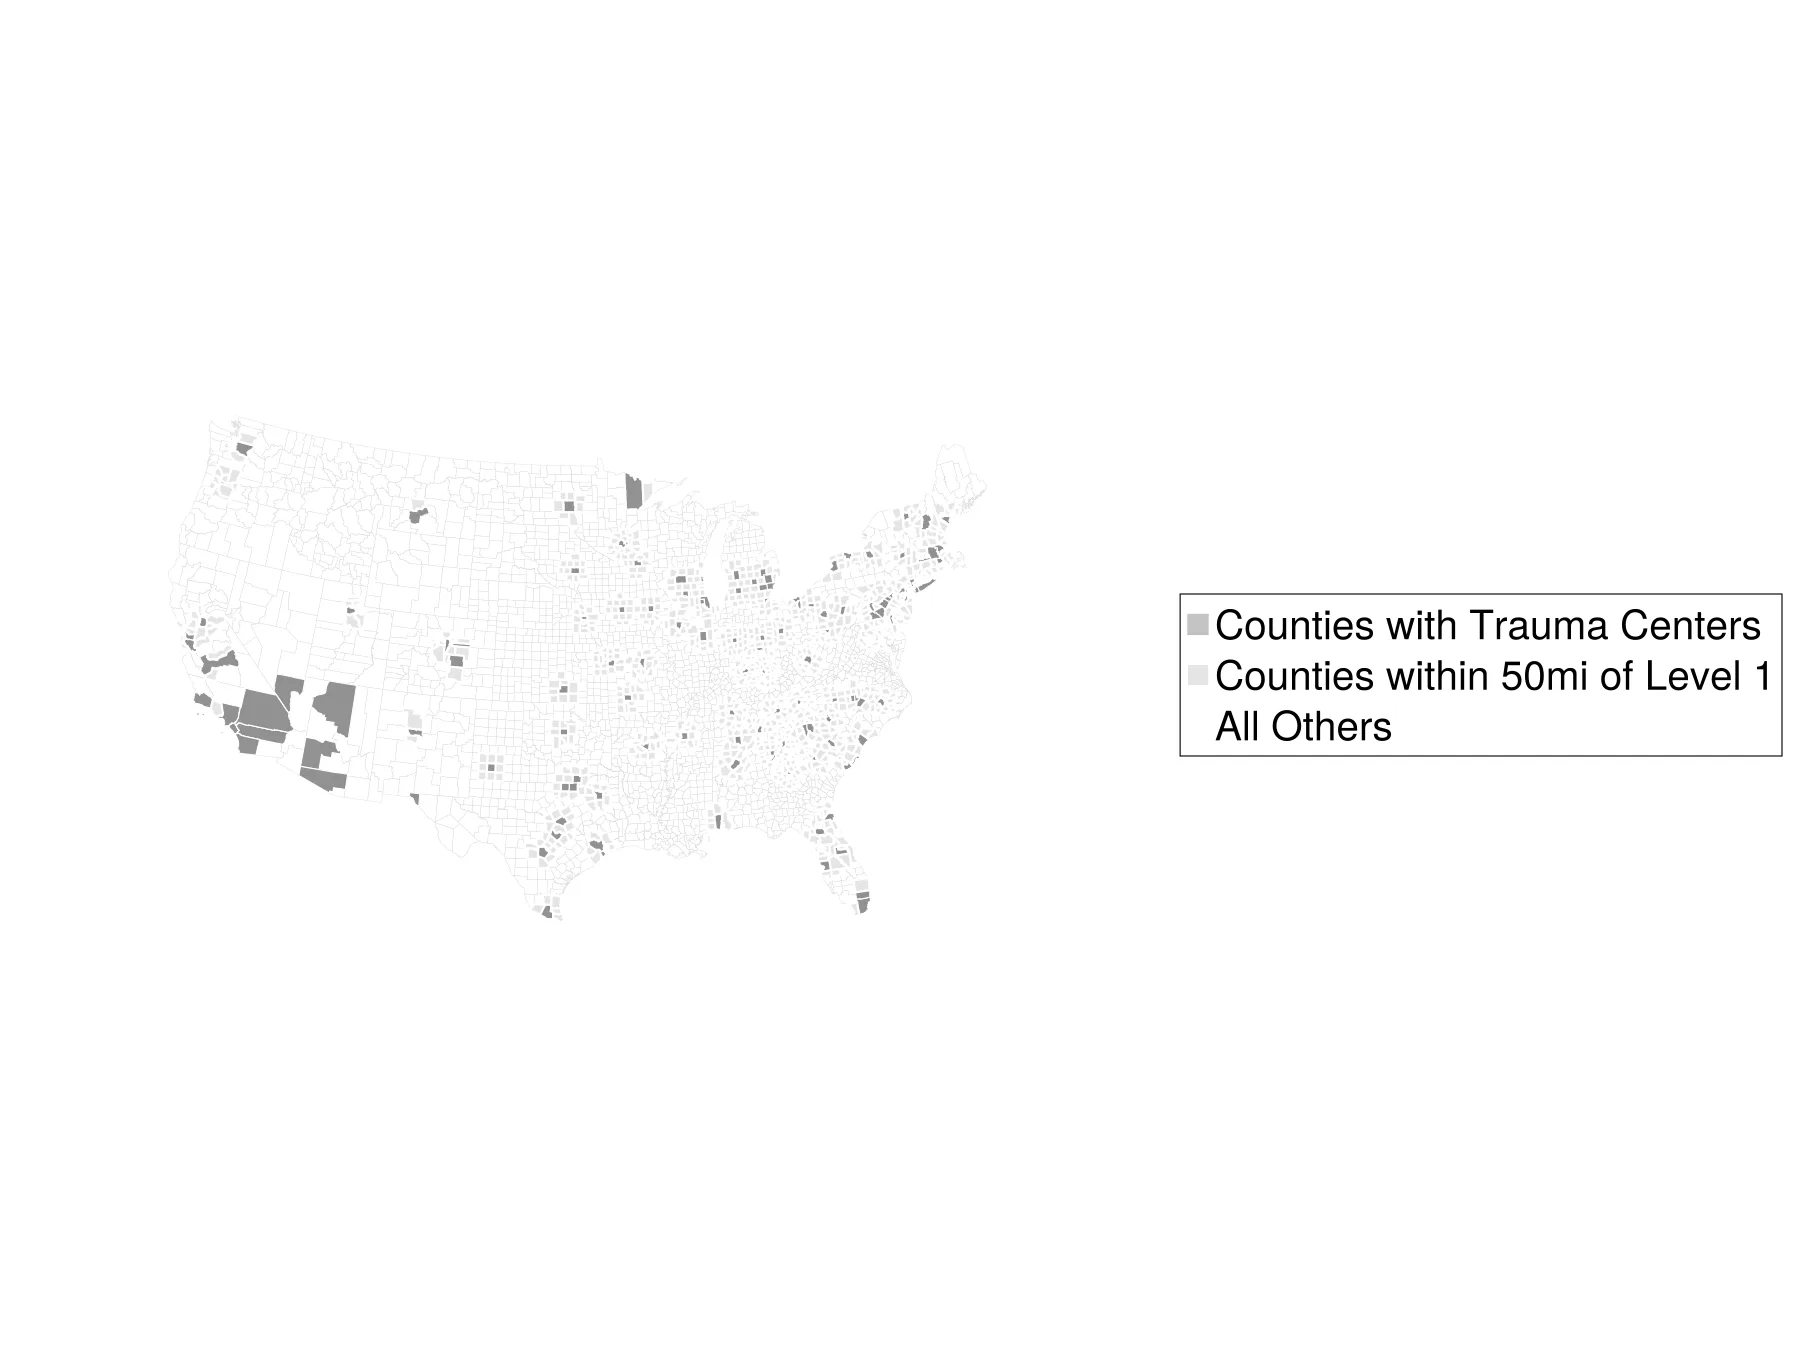
Shades of GrayOpen full size 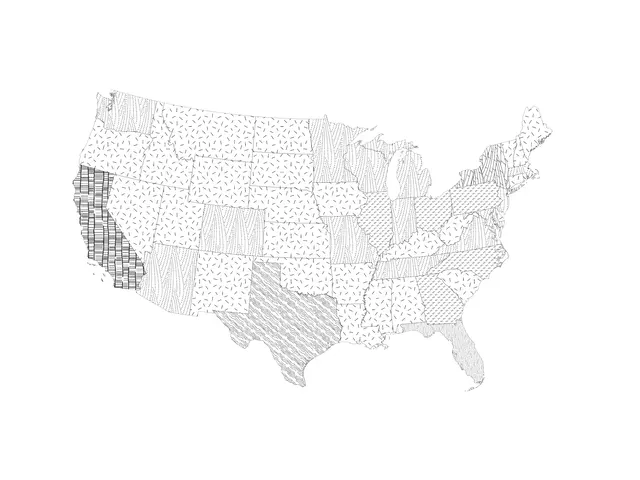
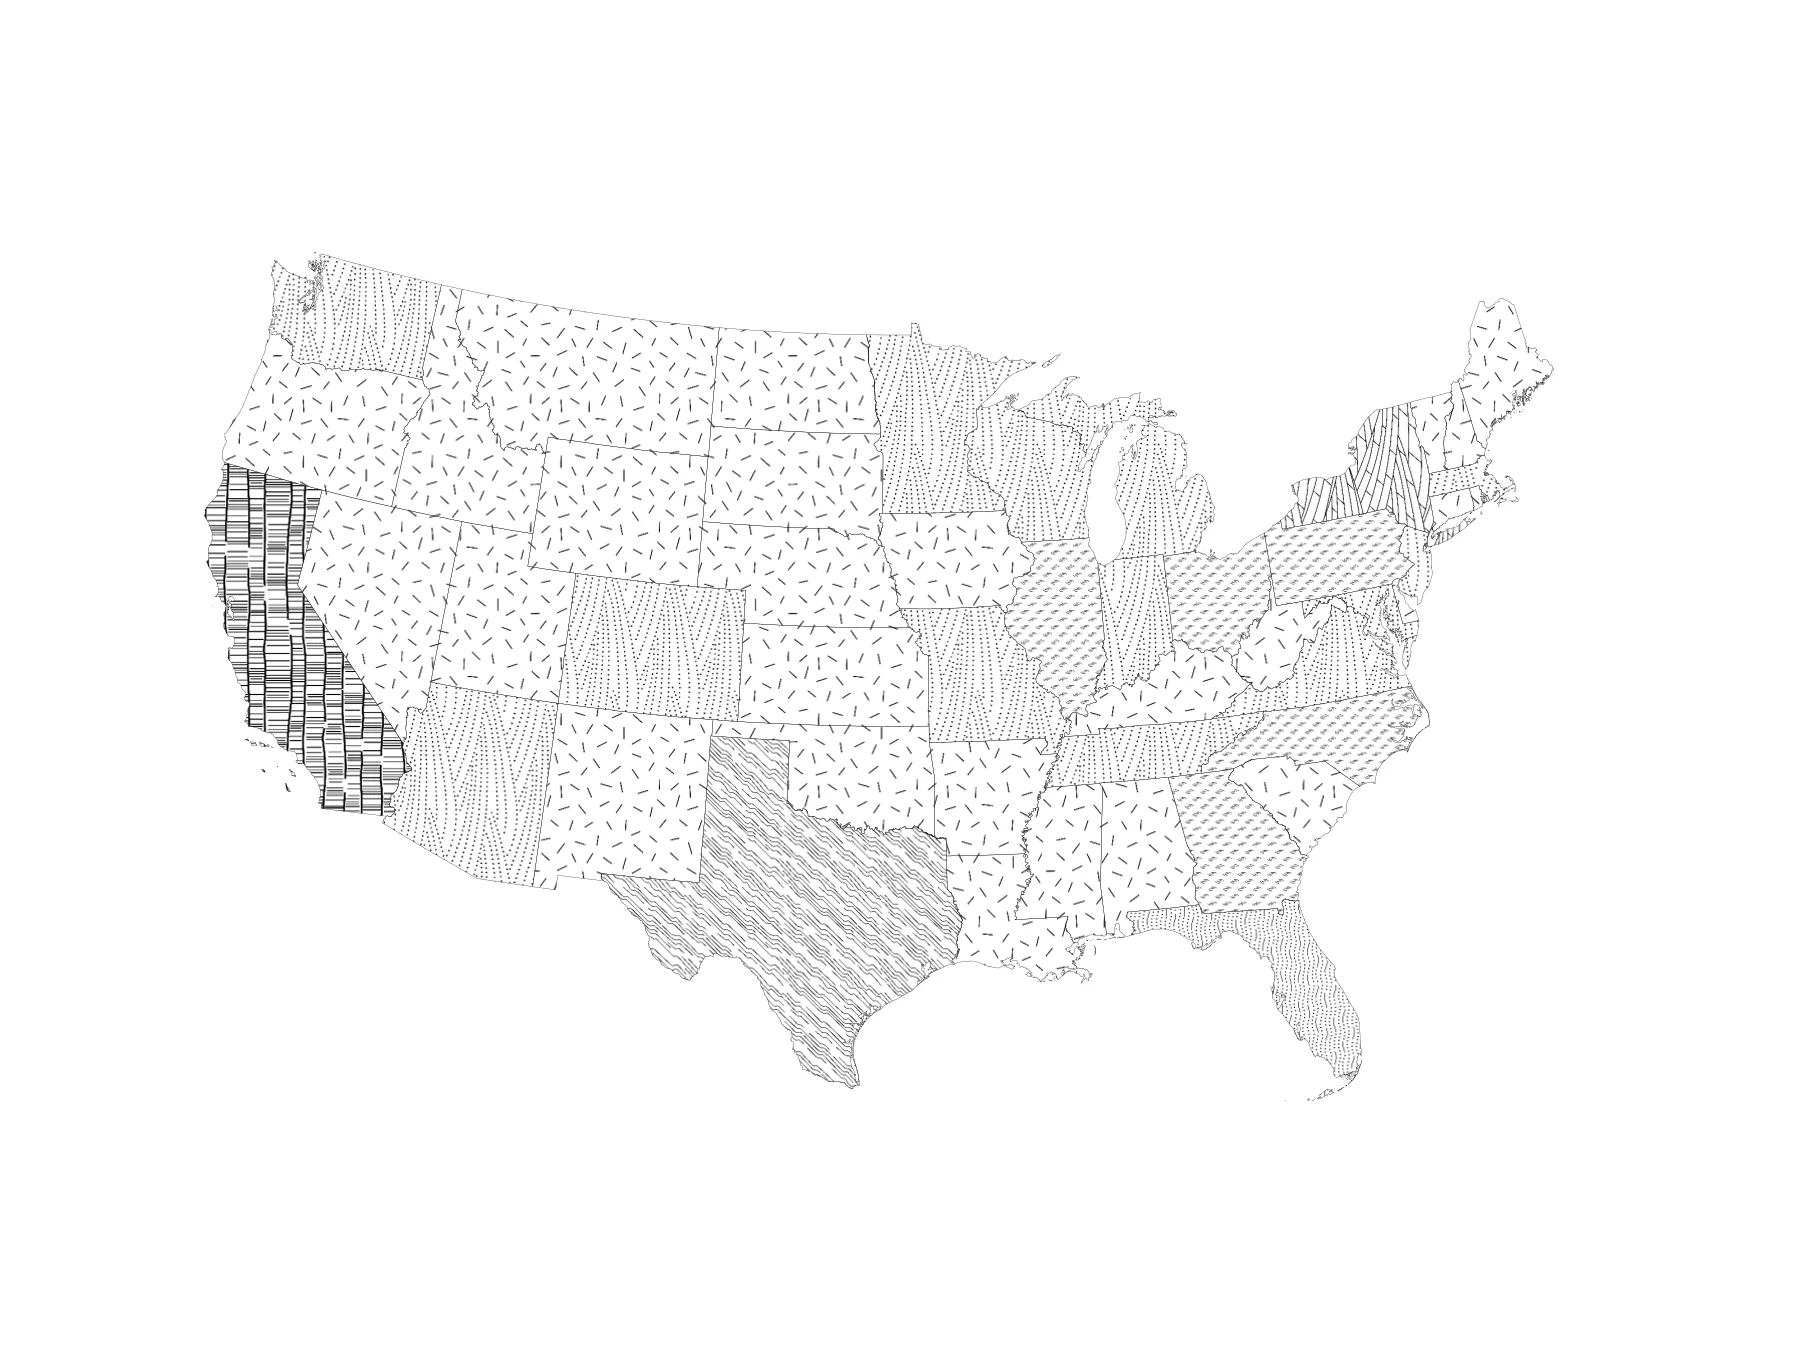
Patterned MapOpen full size
Insets and outsets
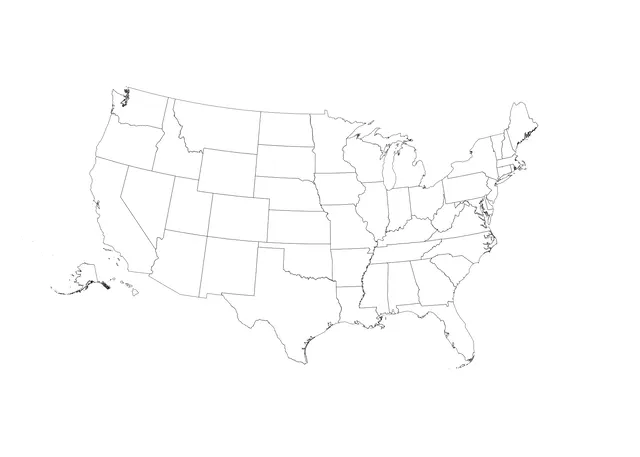
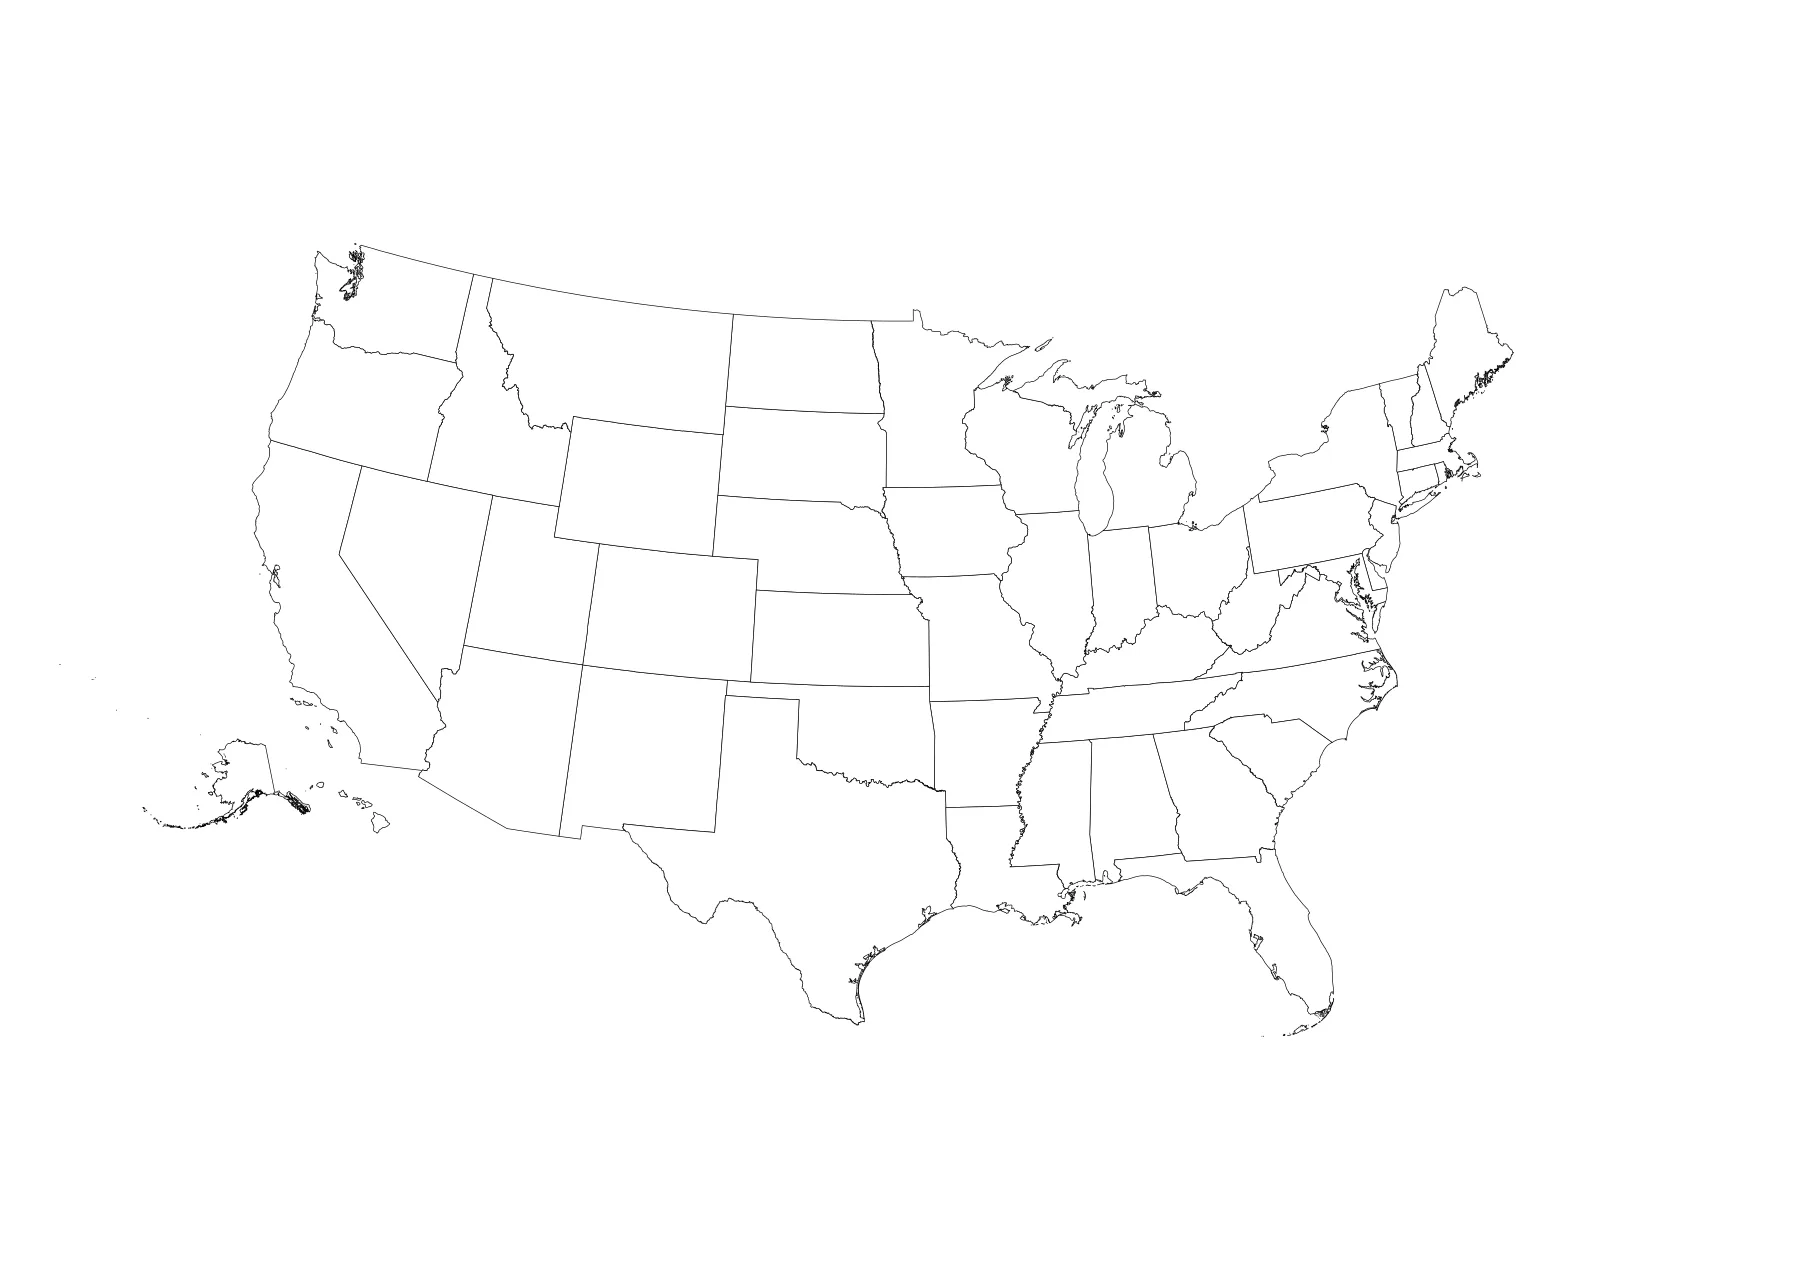
Alaska and Hawaii InsetsOpen full size 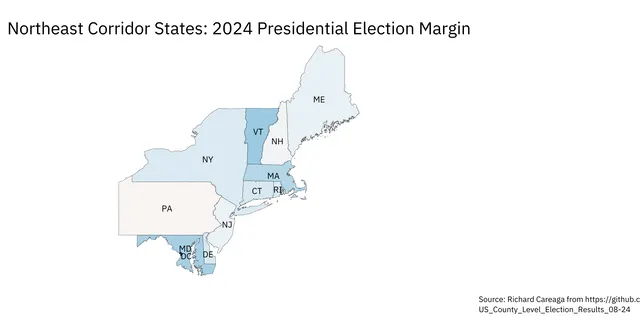
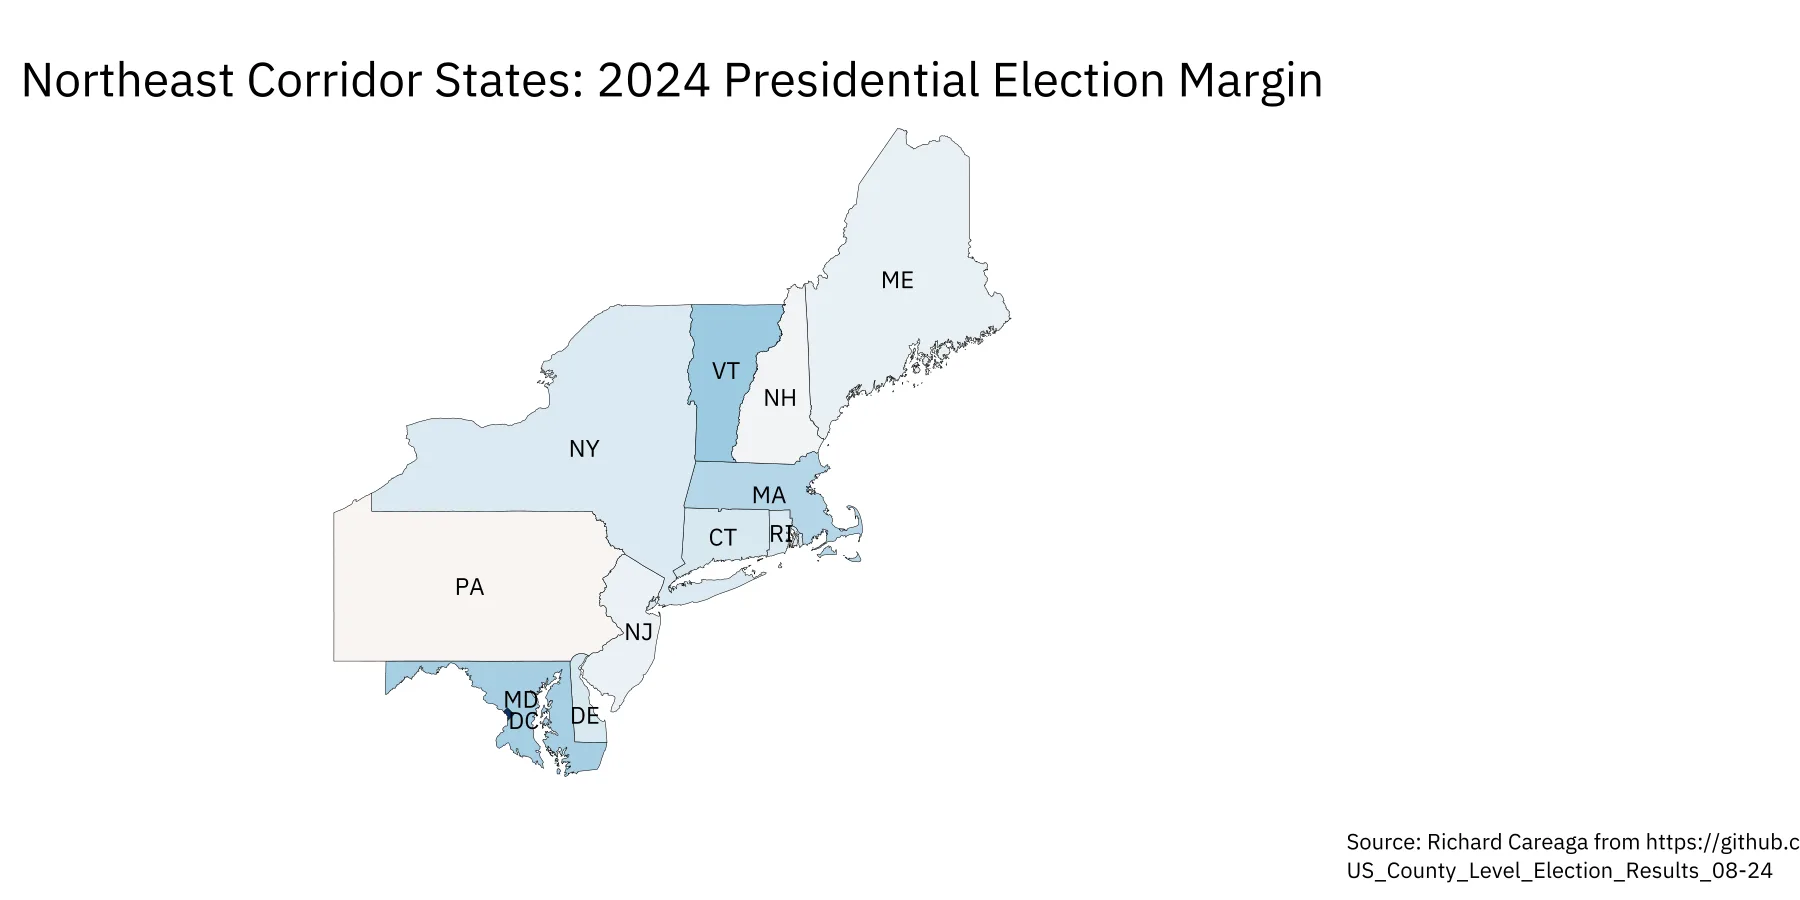
Use of Regional Map to Show DetailOpen full size 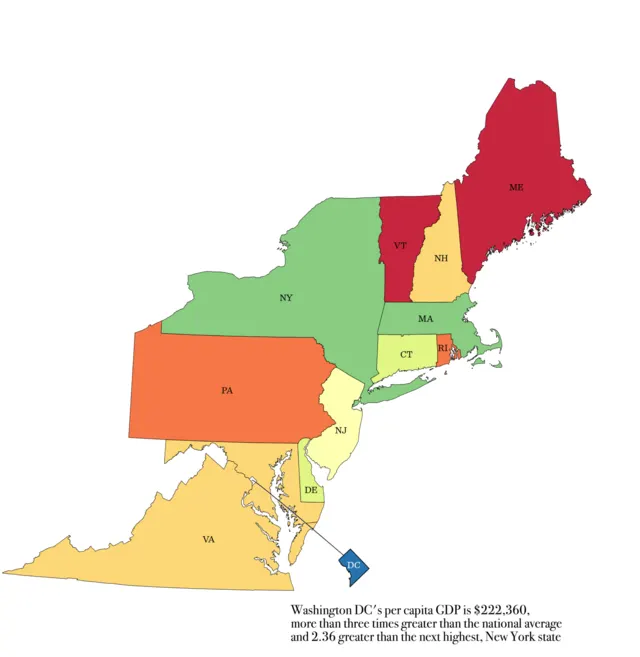
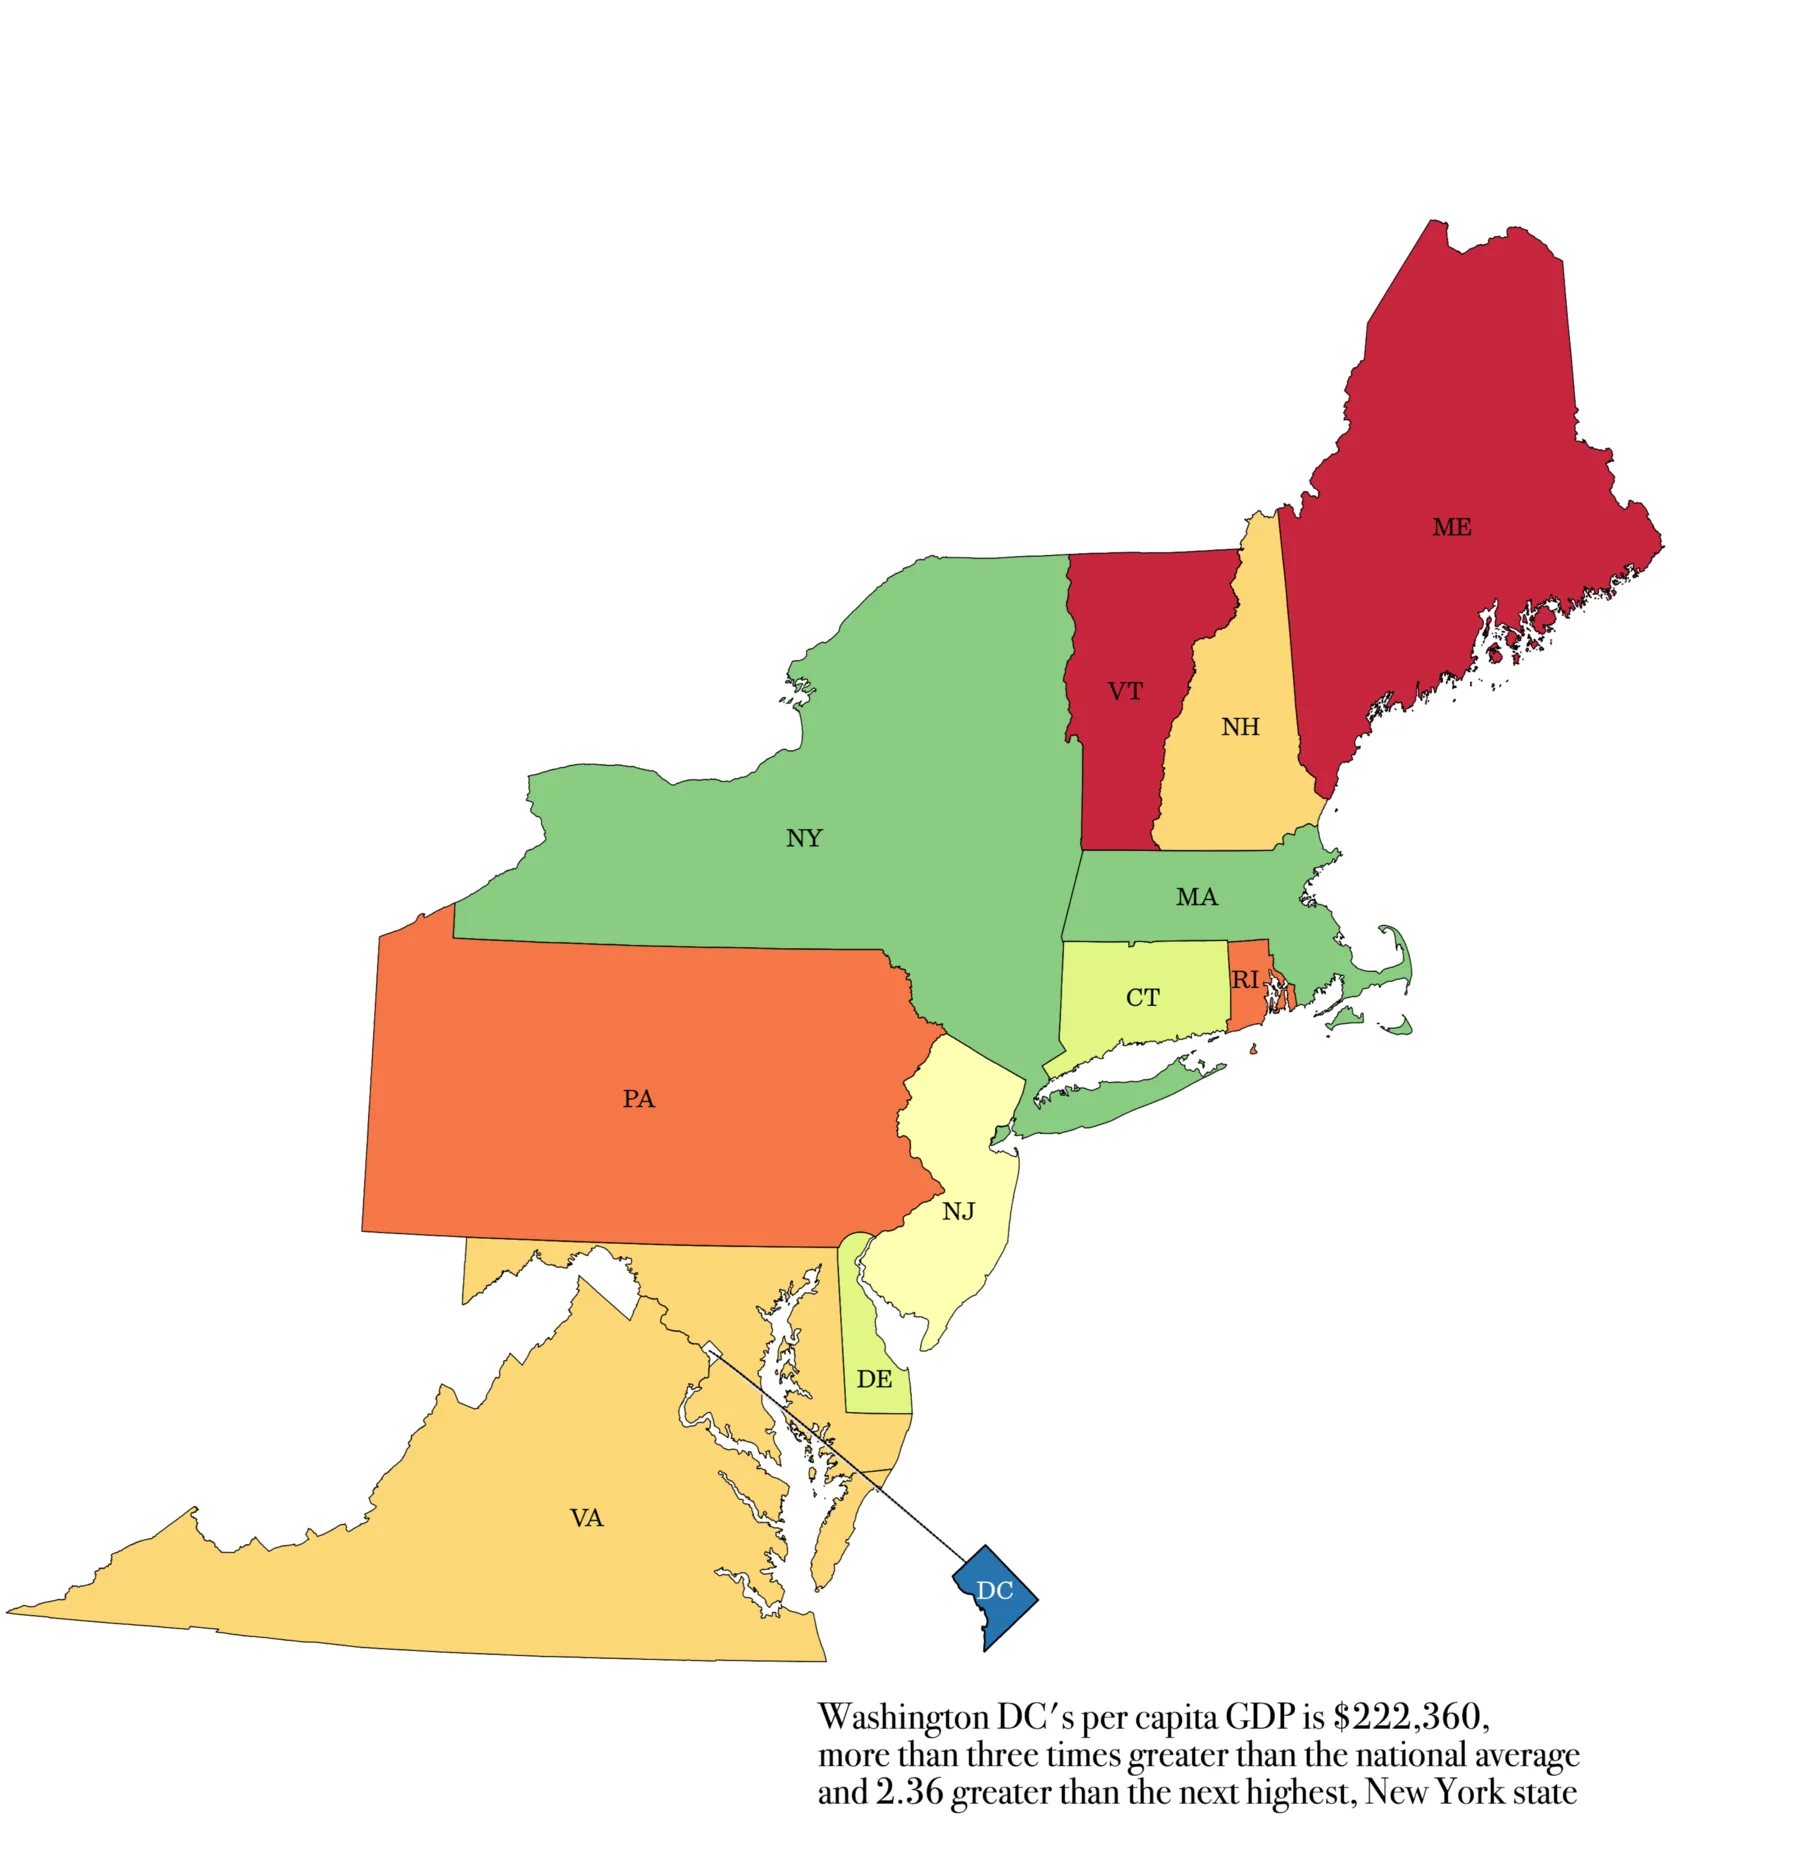
Finished in Vector Editor ApplicationOpen full size
Putting it all together
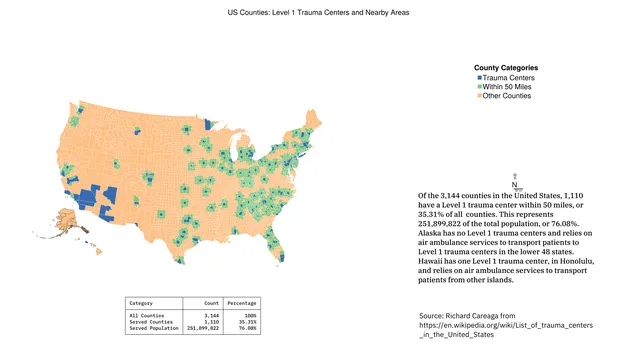
Plot with Optional ElementsOpen full size
Radius maps
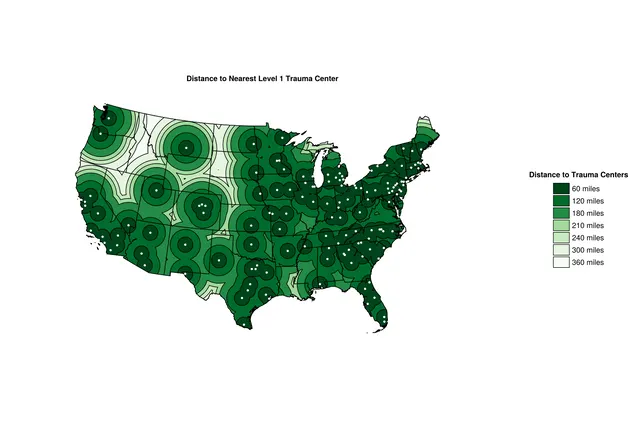
Example of a Radius MapOpen full size
Network data
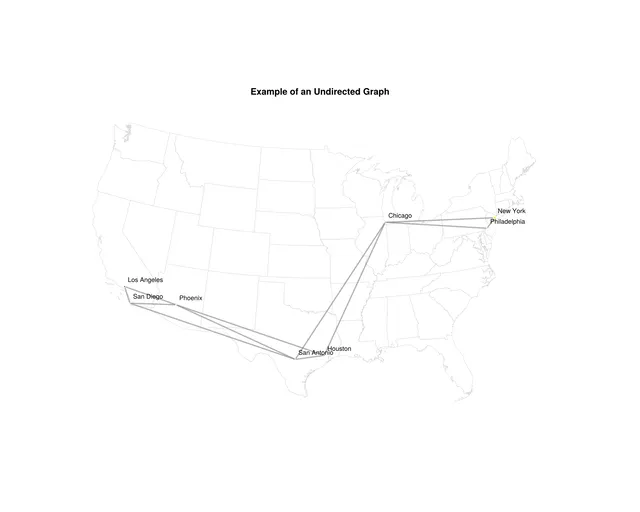
Undirected Graph Map ExampleOpen full size 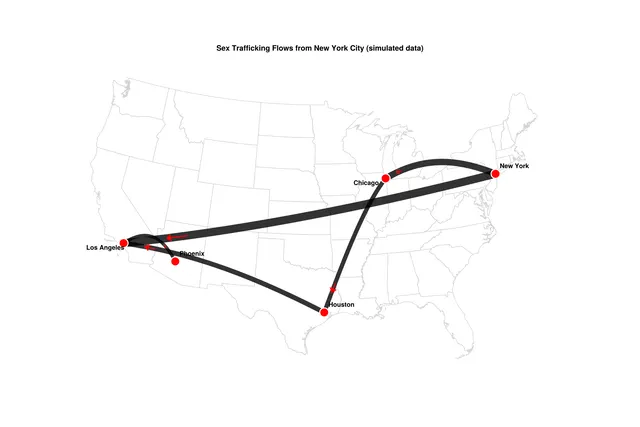
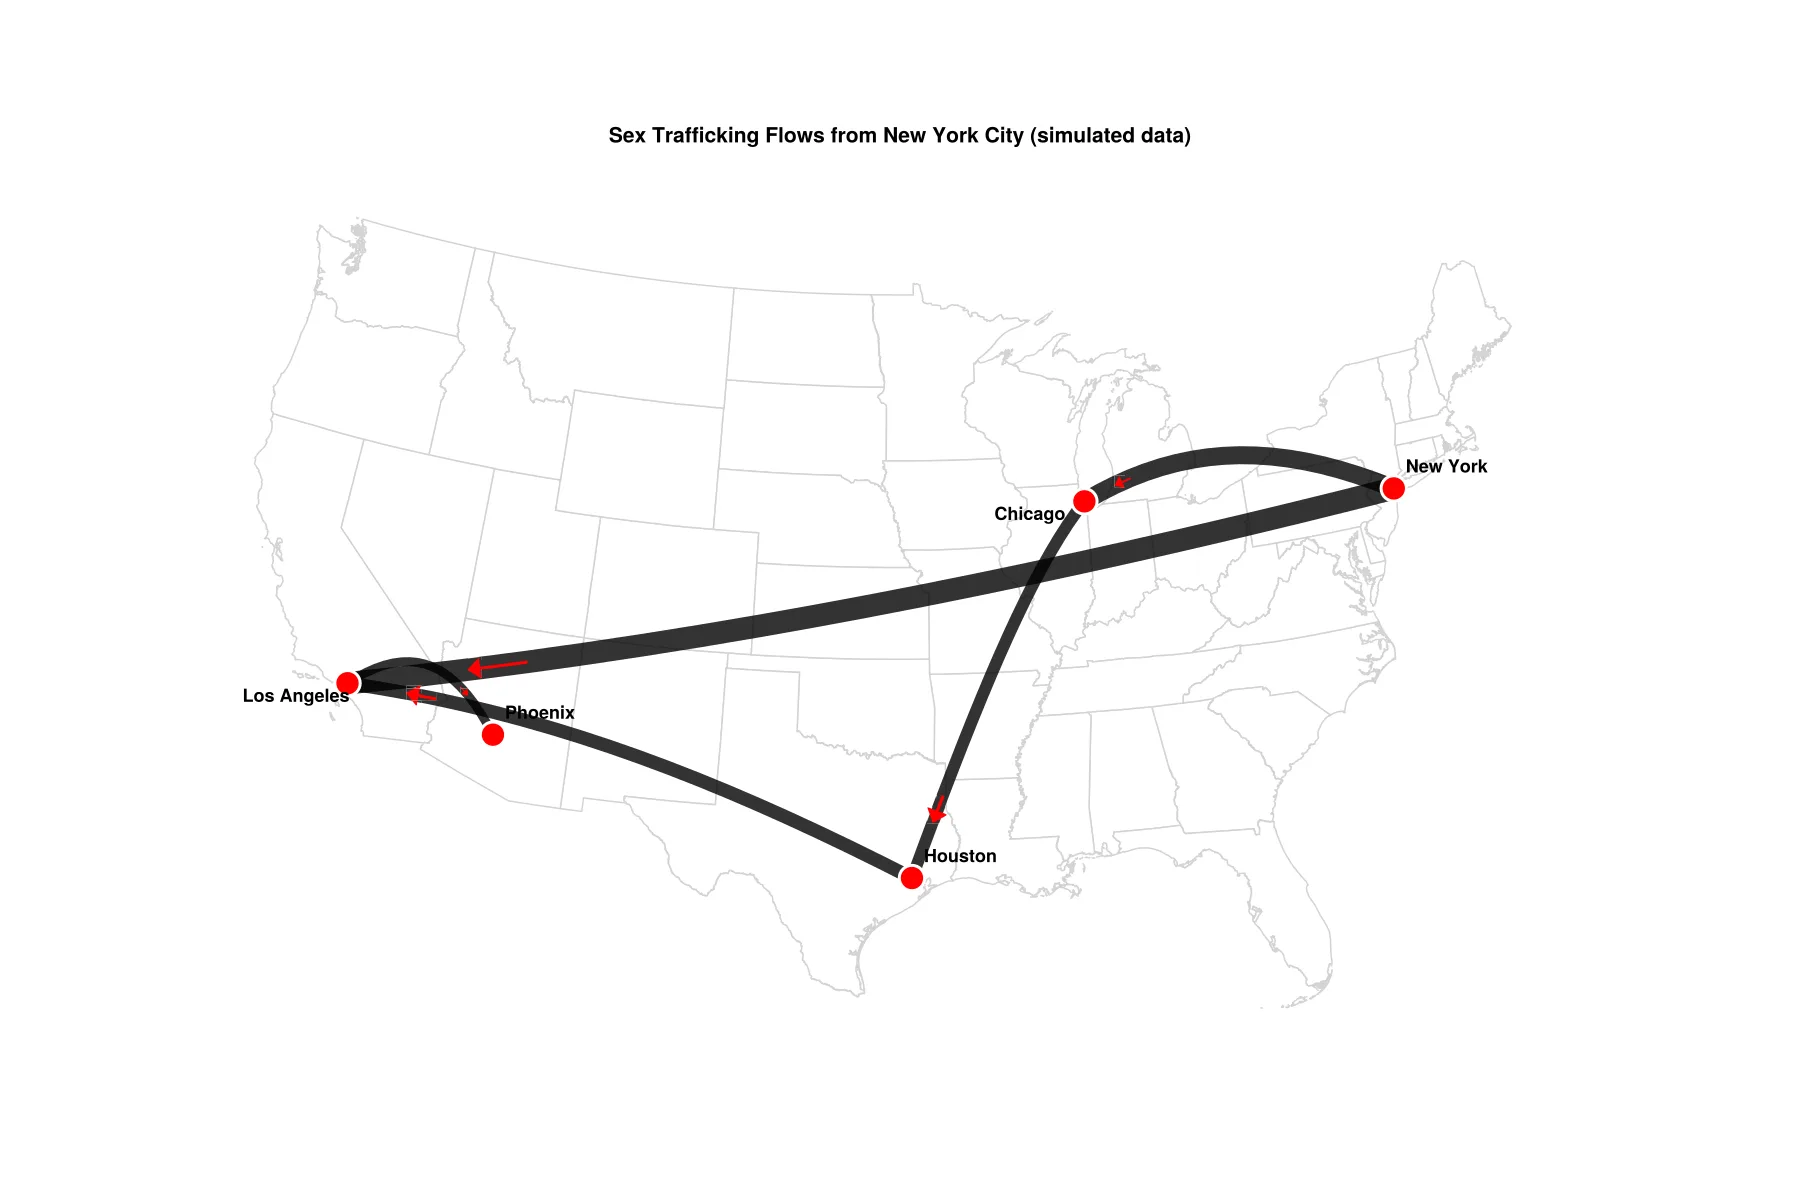
Flow Map ExampleOpen full size 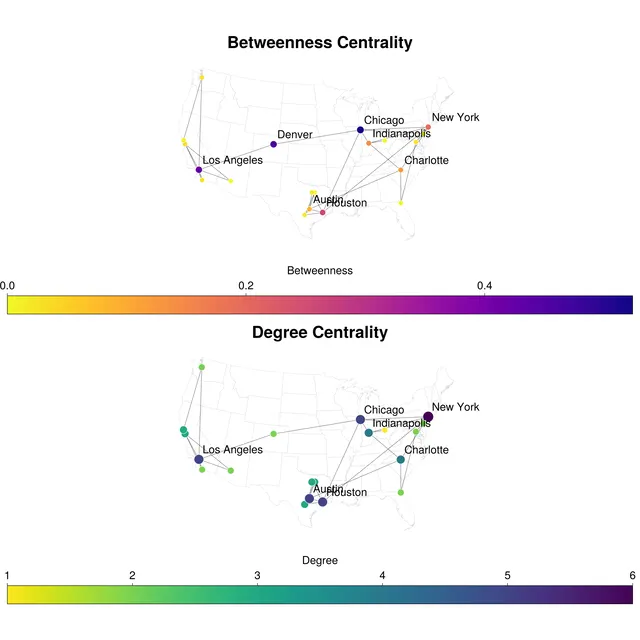
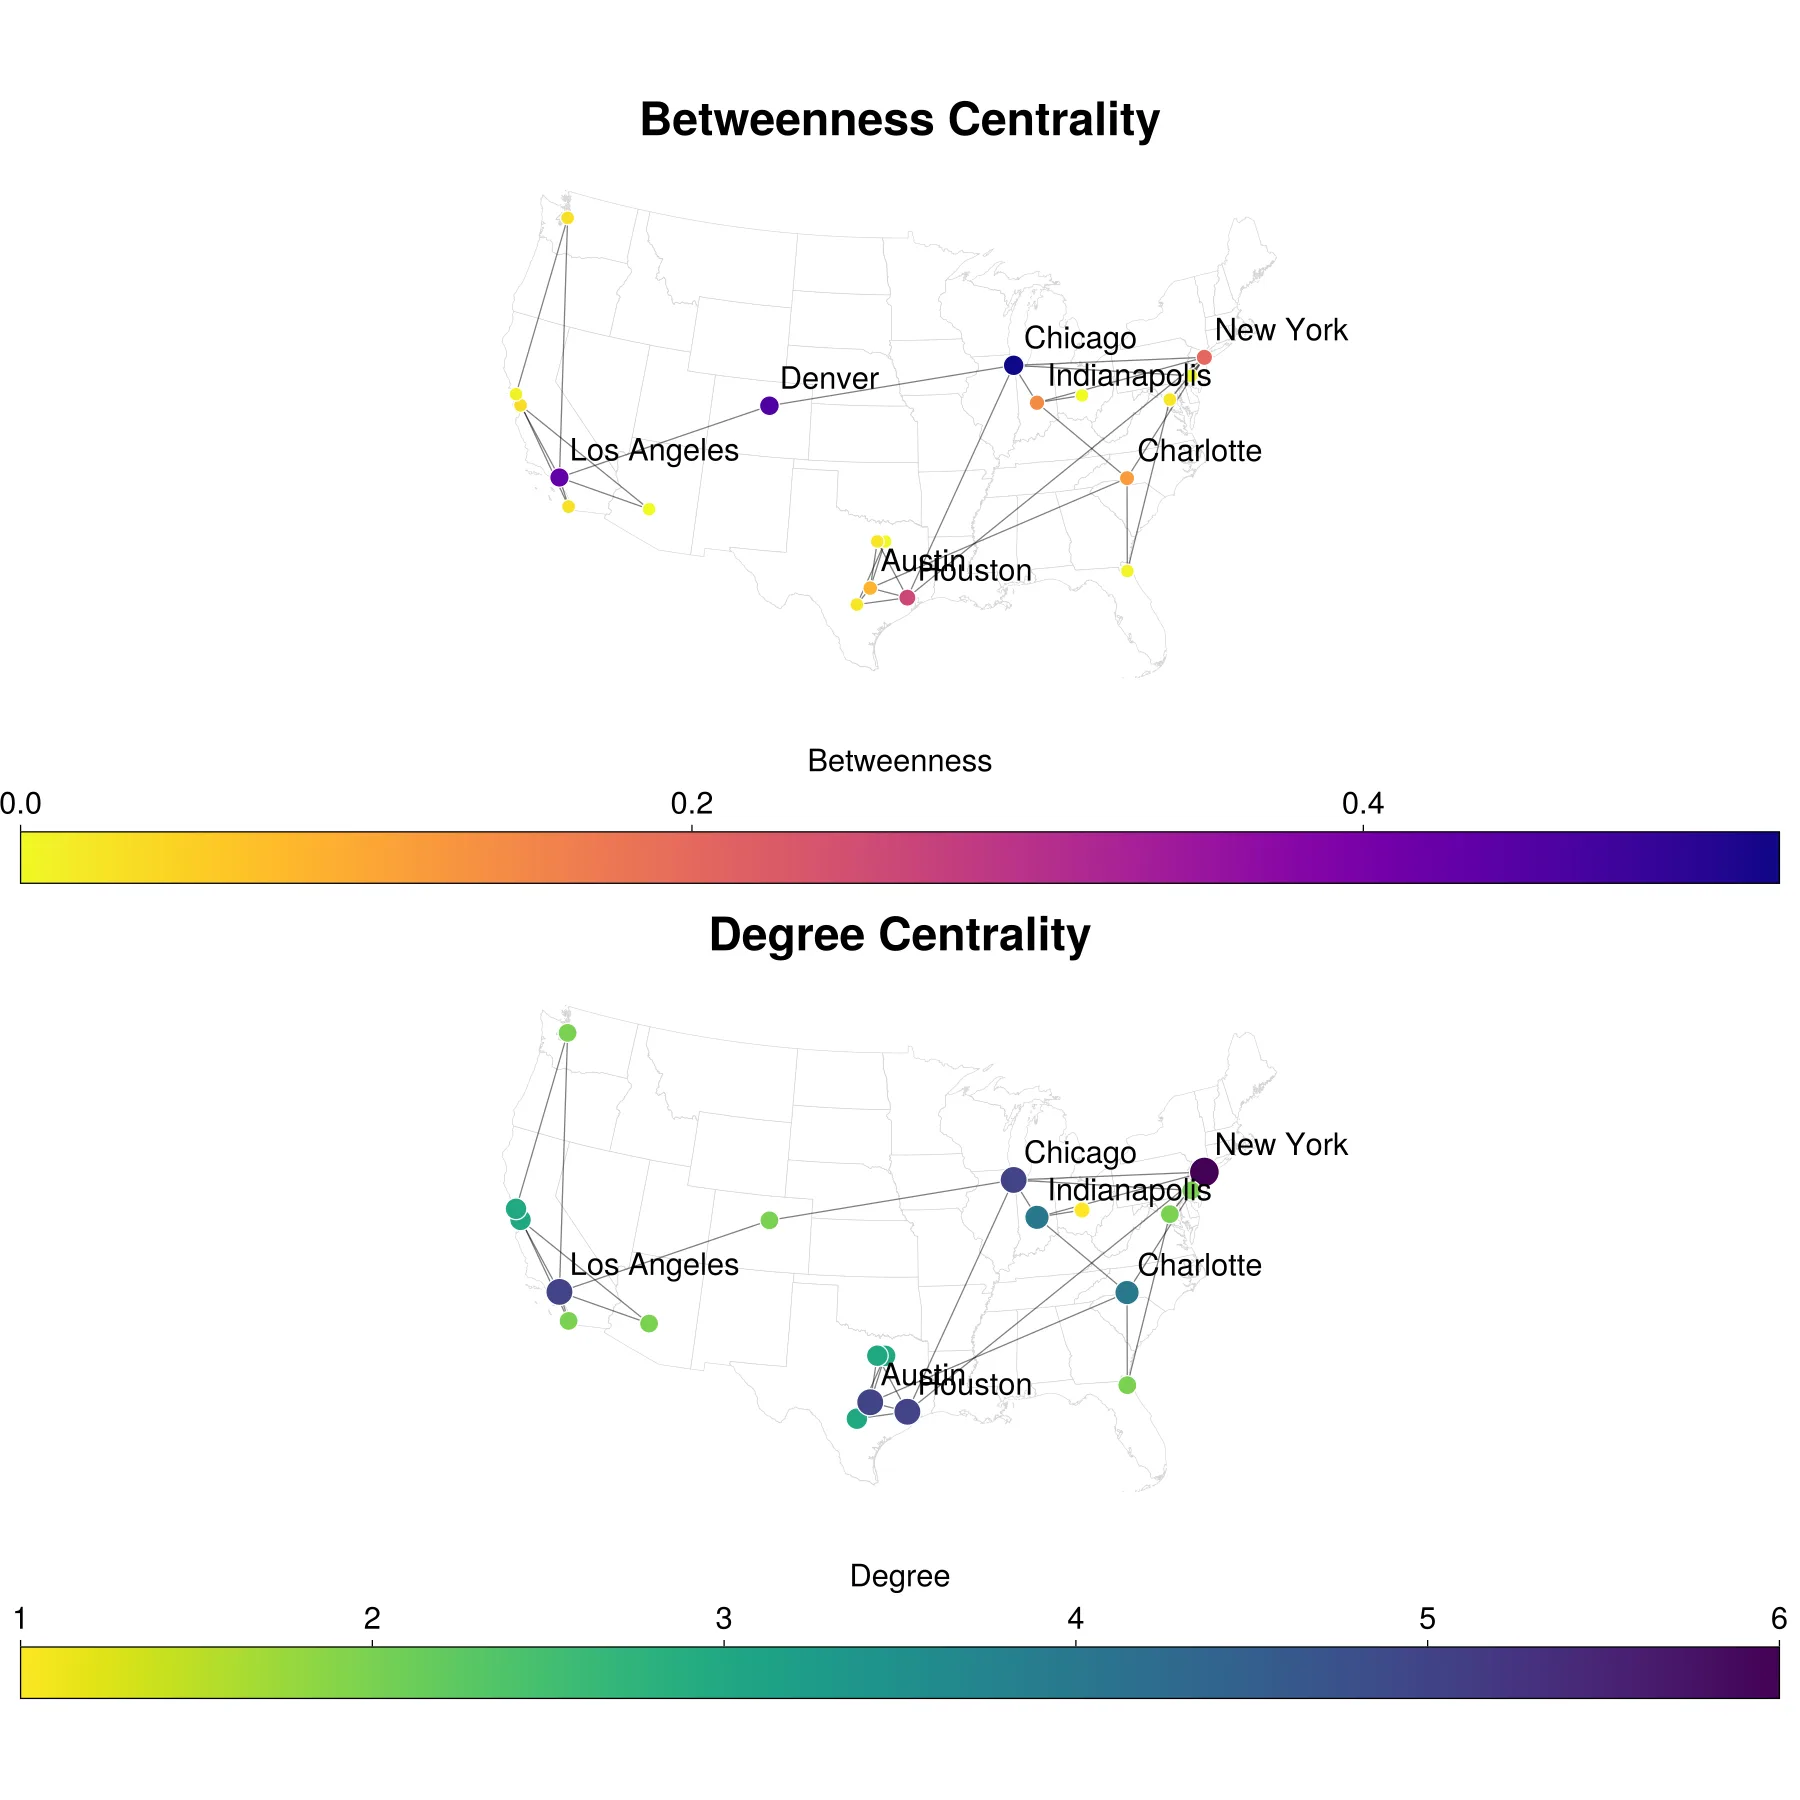
Betweenness and CentralityOpen full size 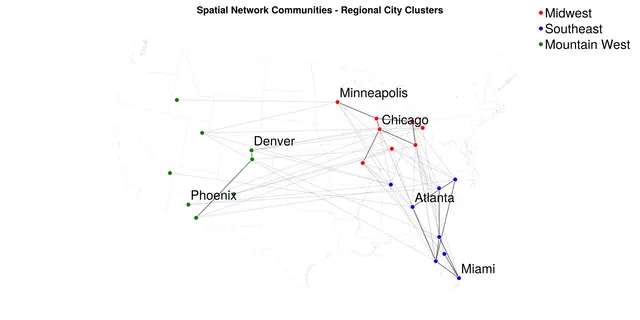
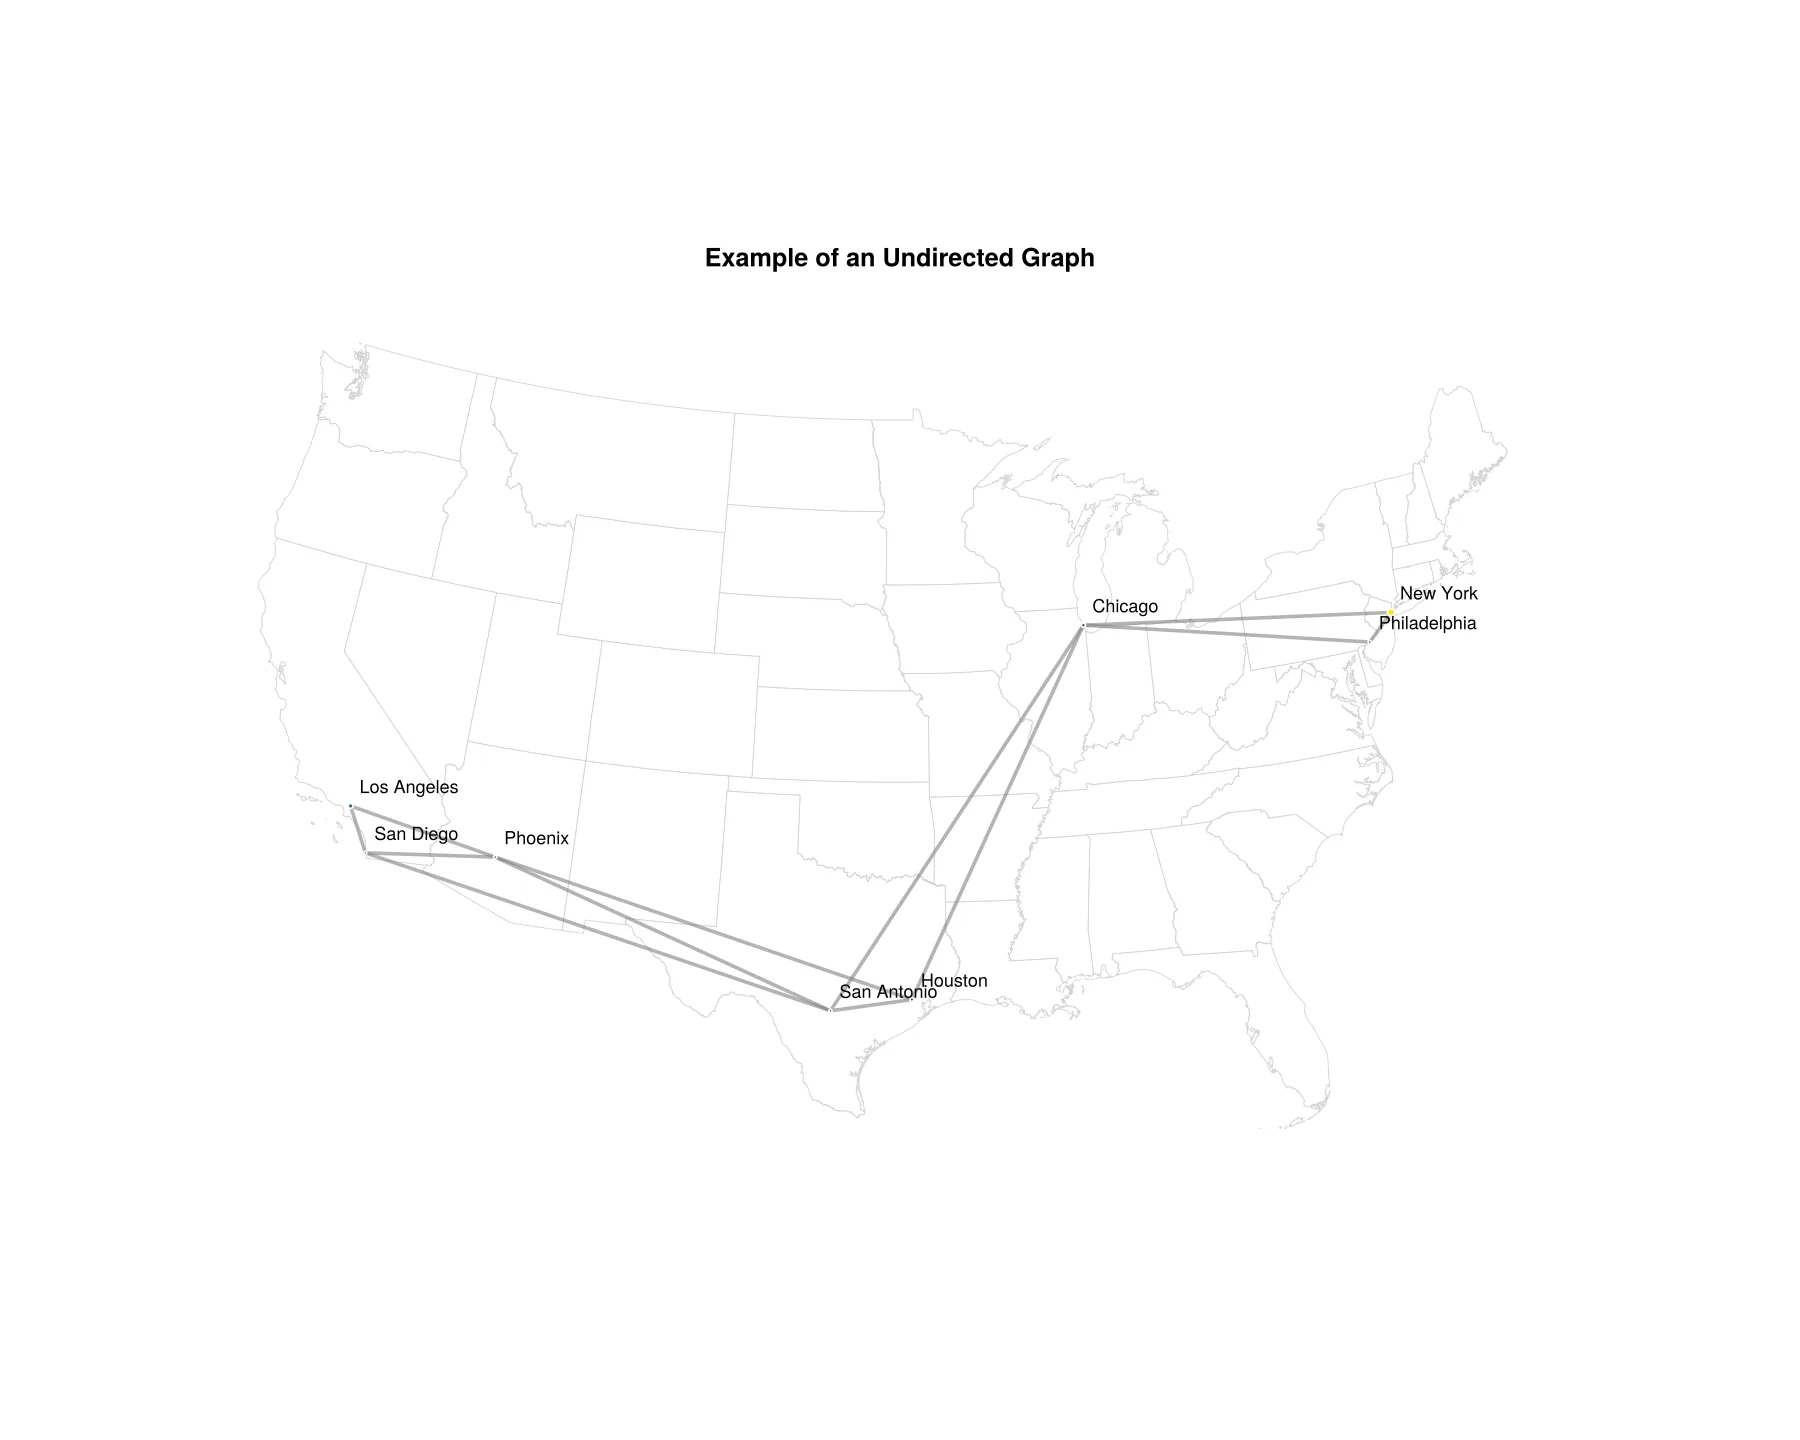
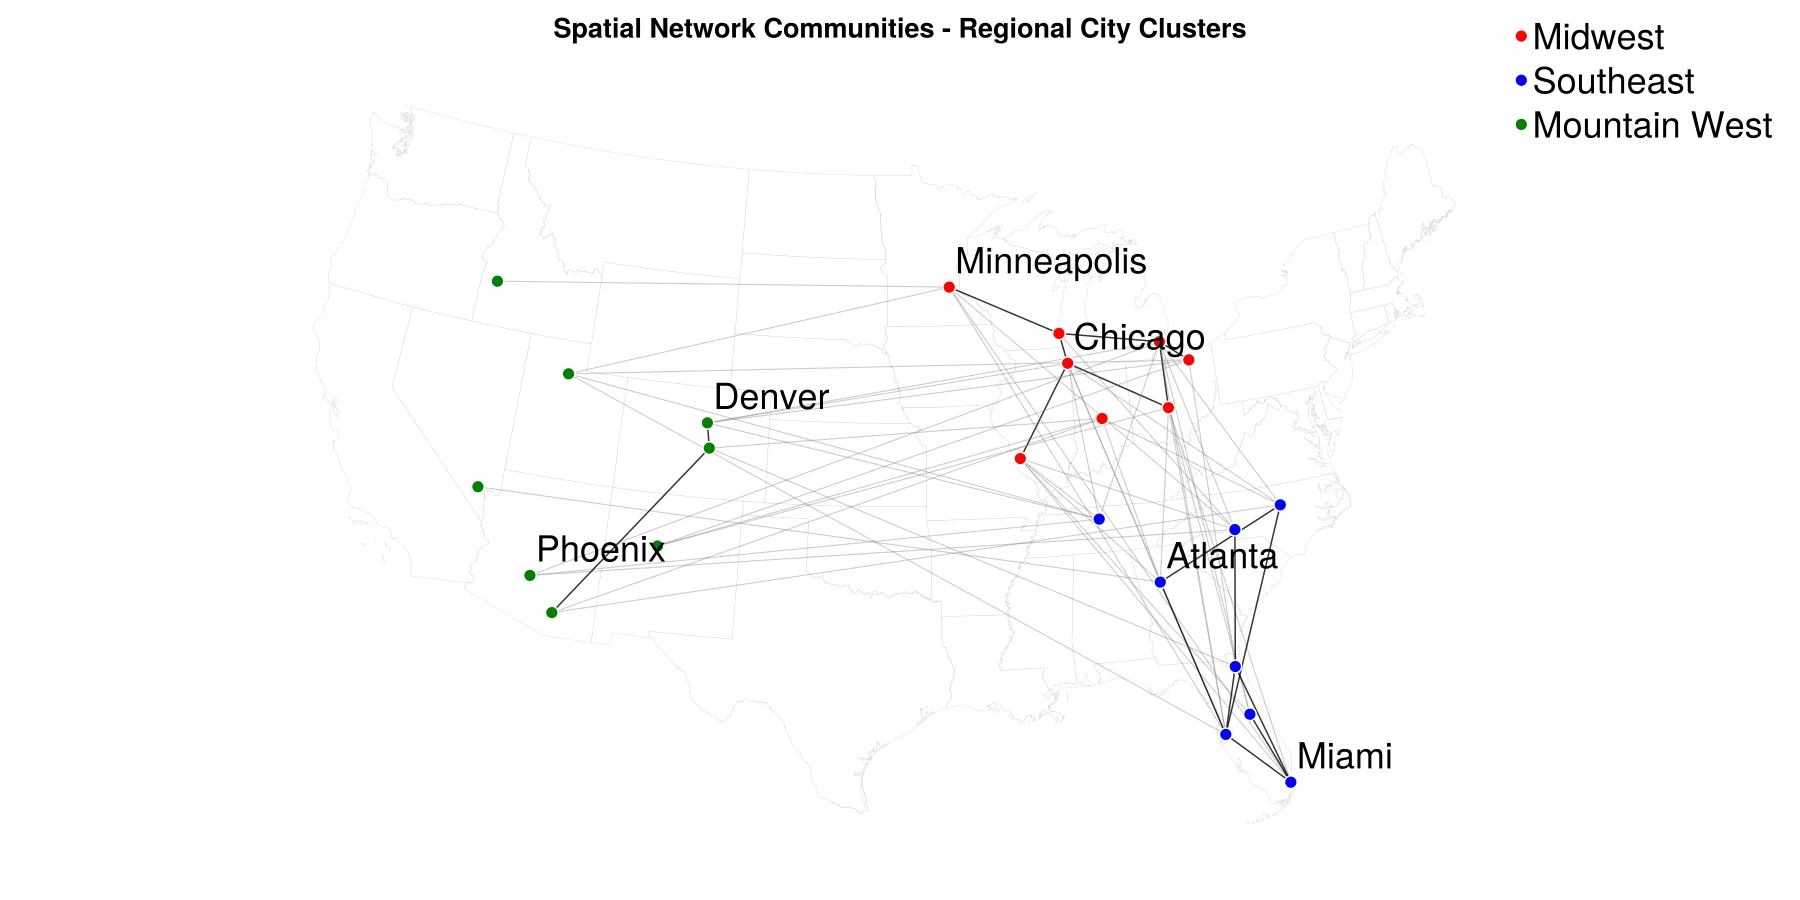
Regional ClusteringOpen full size
Bivariate maps
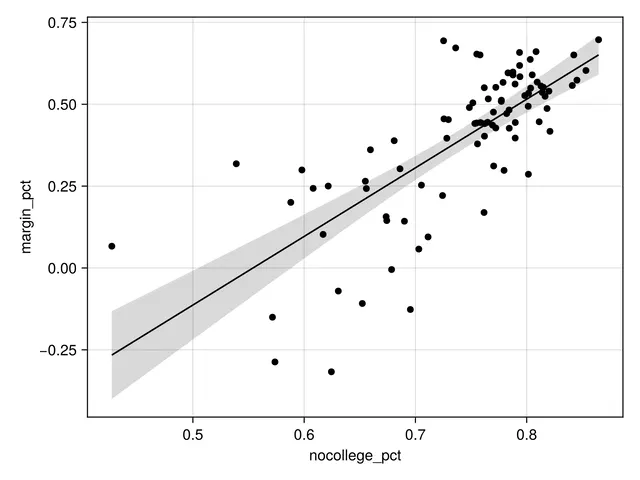
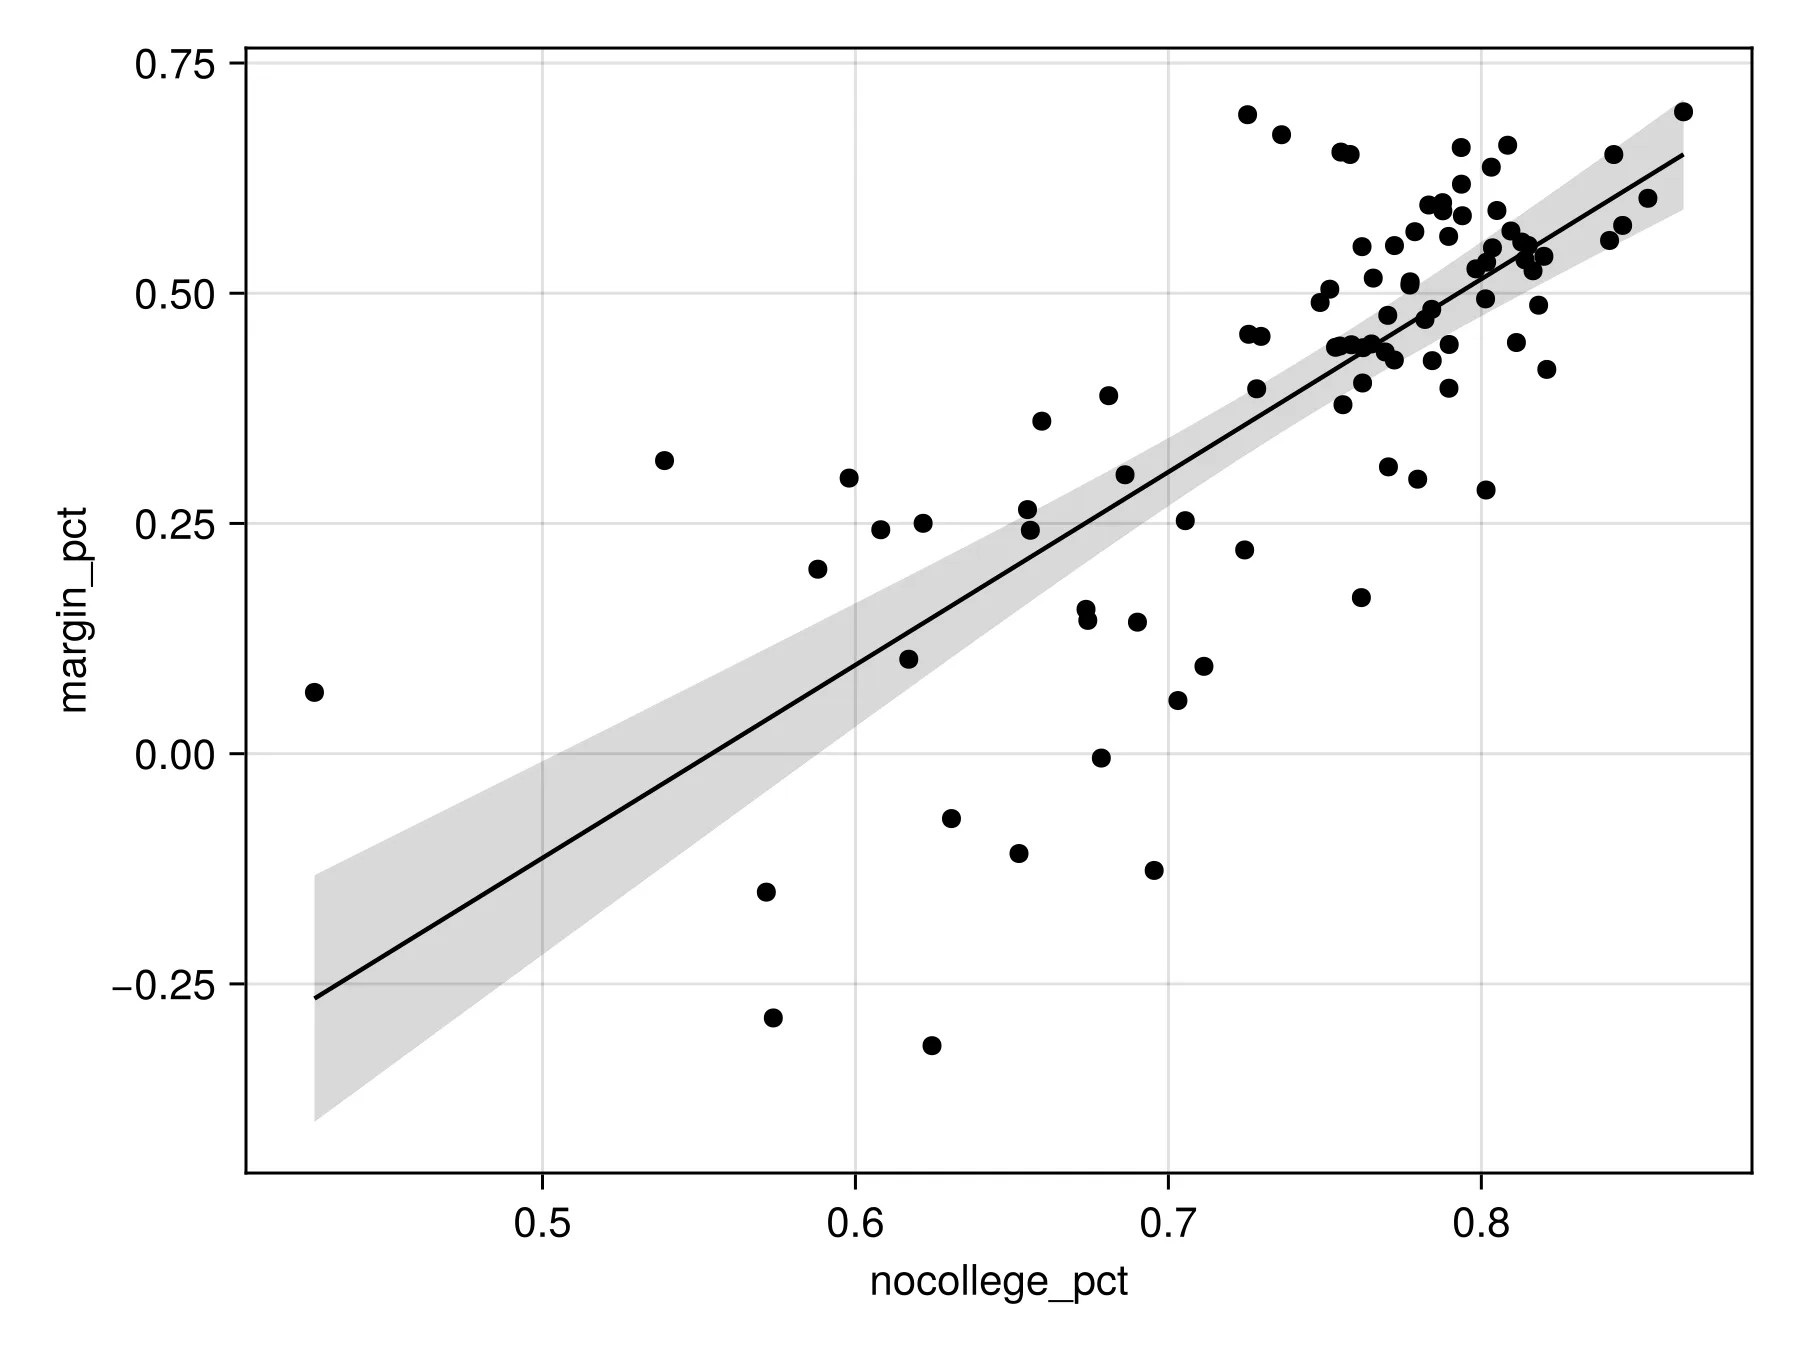
Linear Regression Model of Ohio ElectionOpen full size 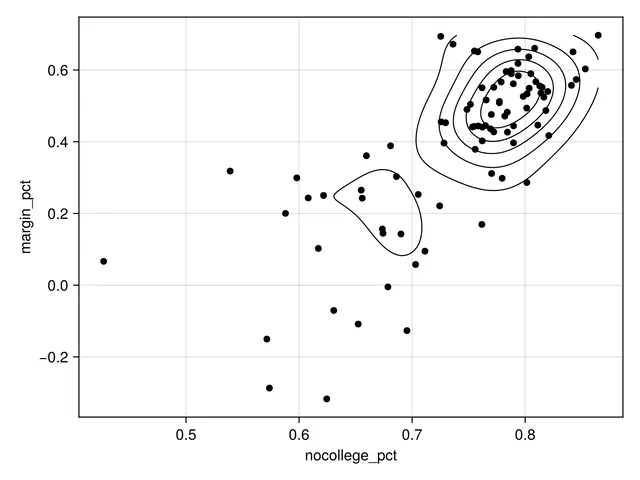
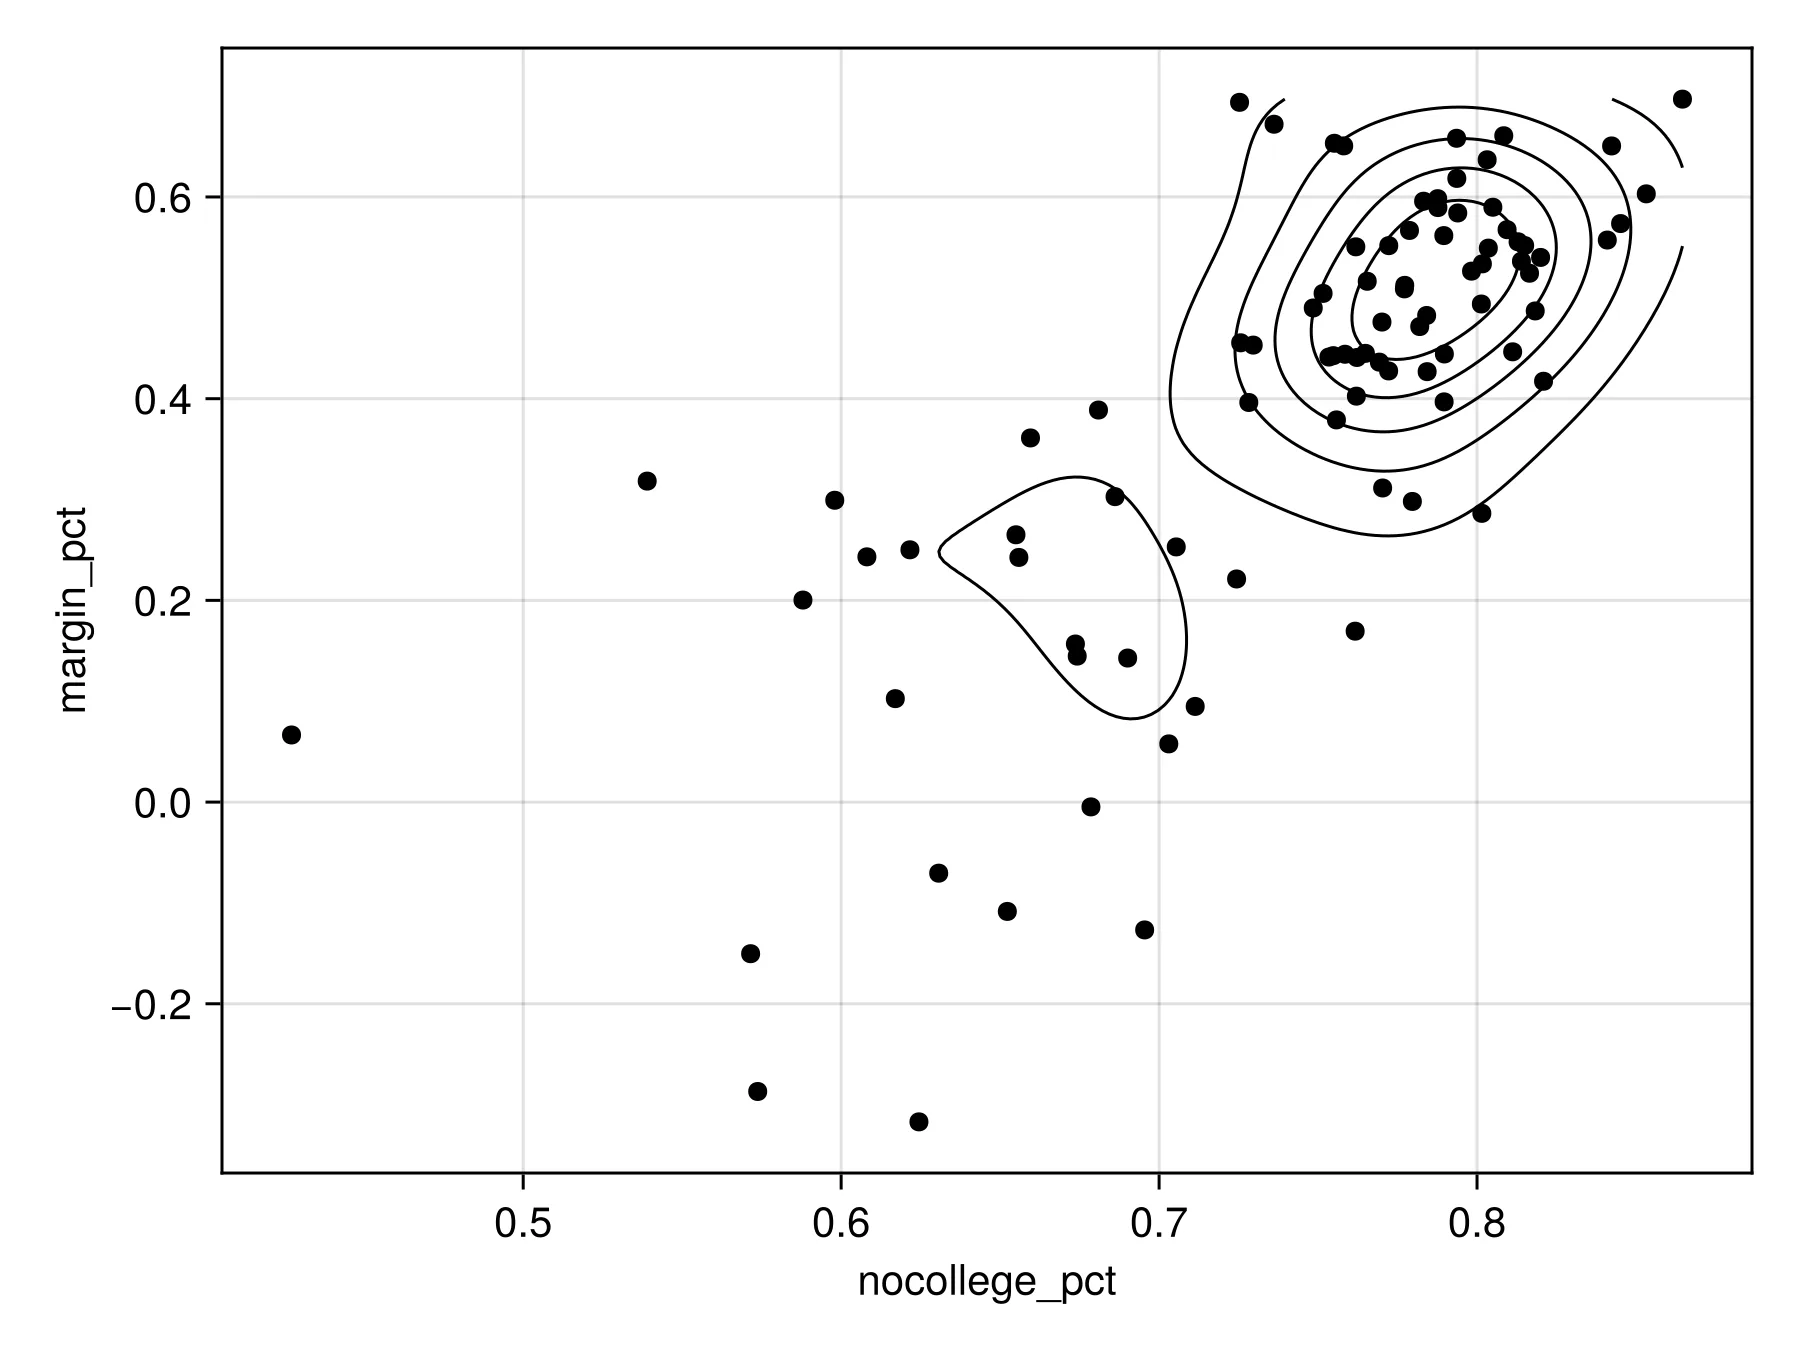
Density Plot of Ohio ElectionOpen full size 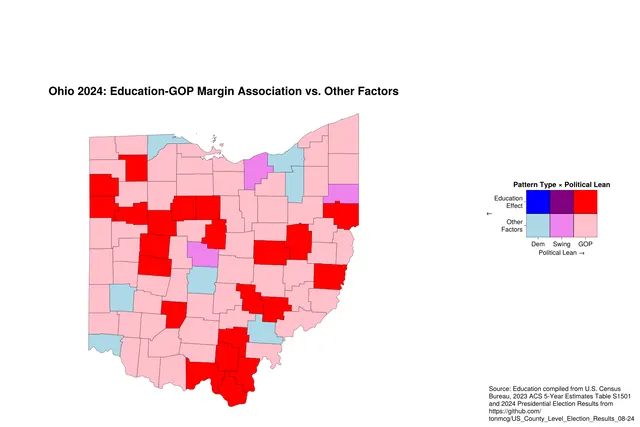
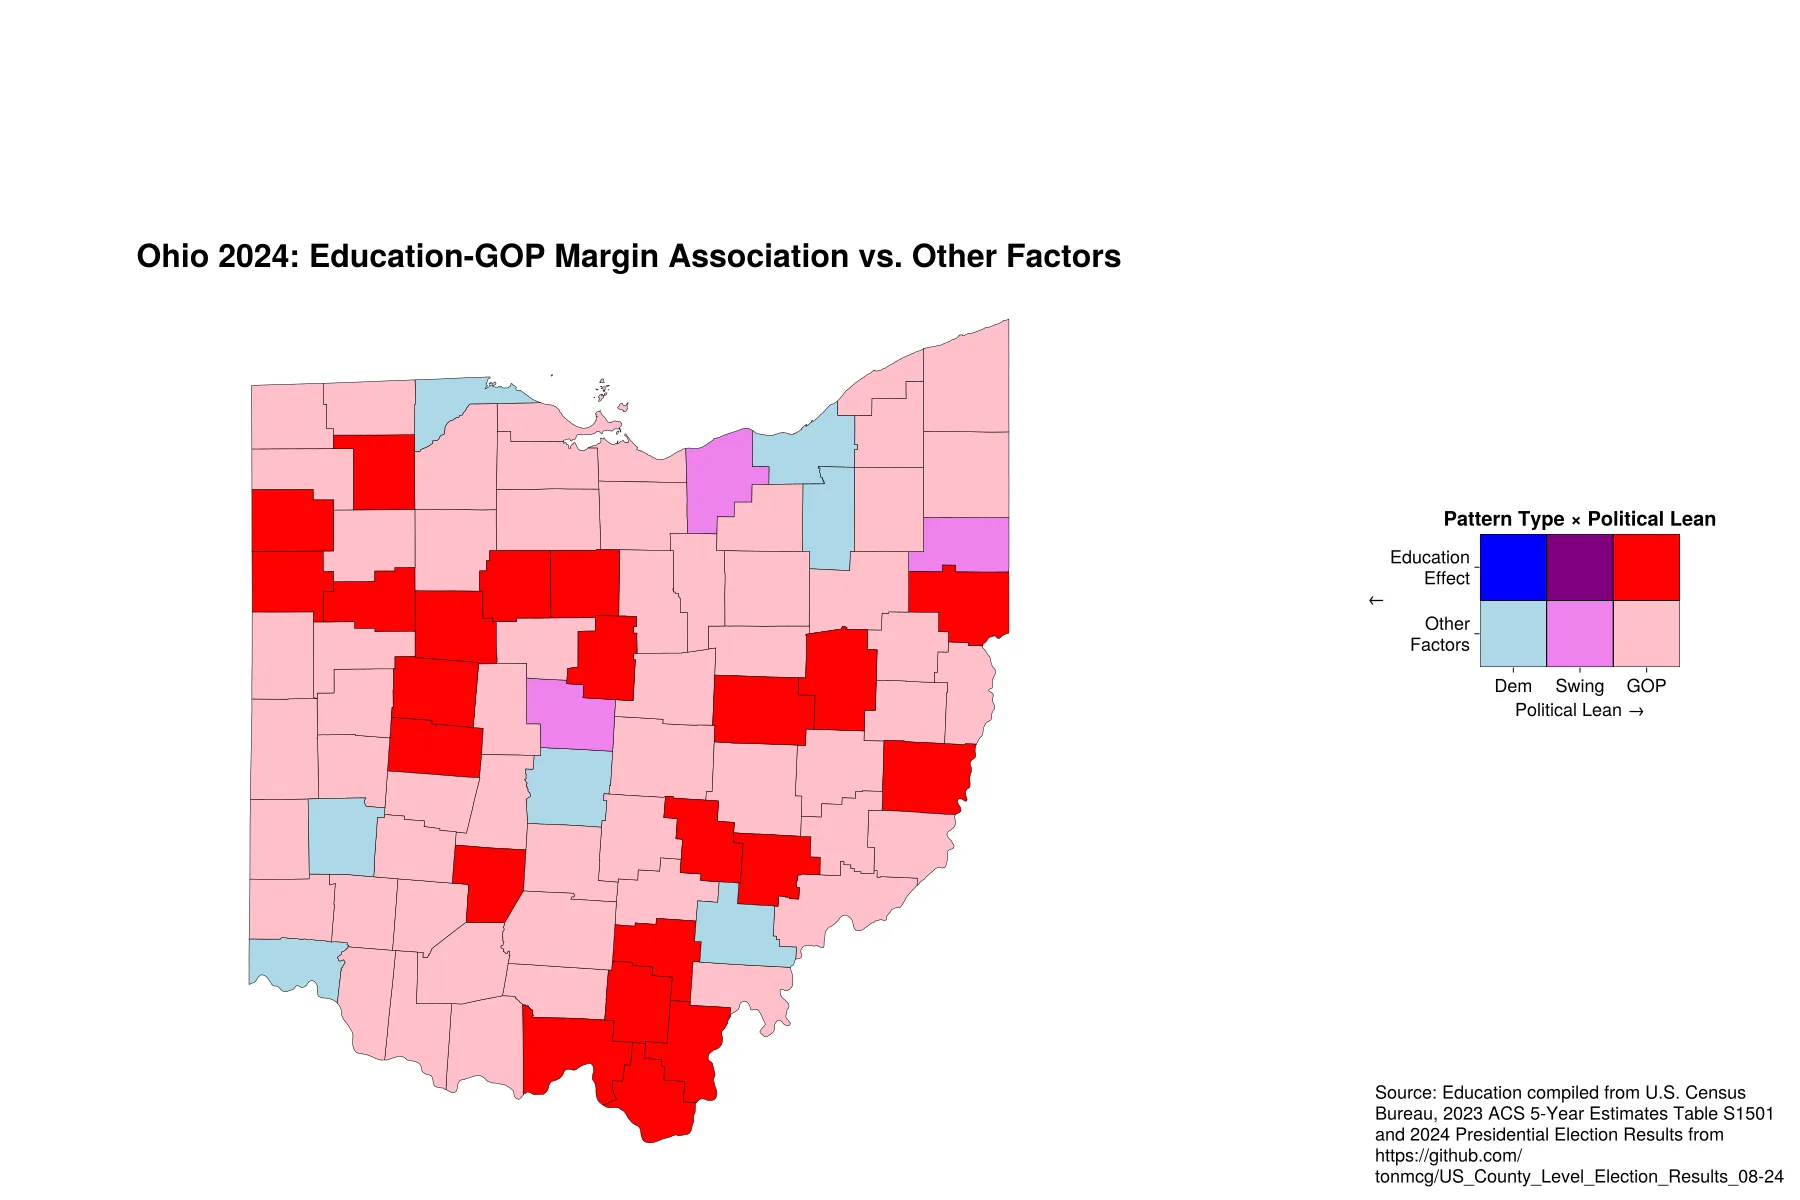
Bivariate Map ExampleOpen full size
Dot density maps
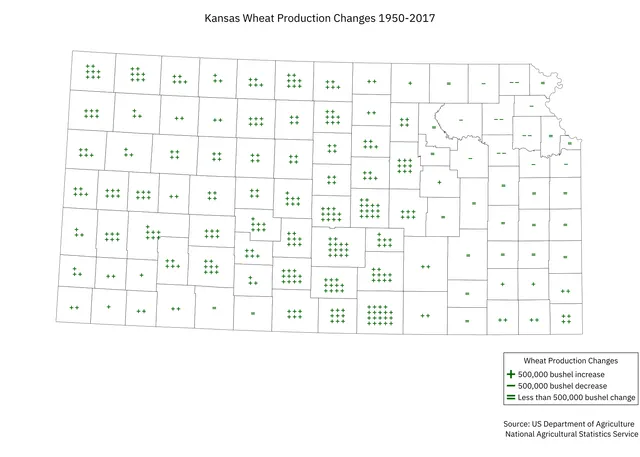
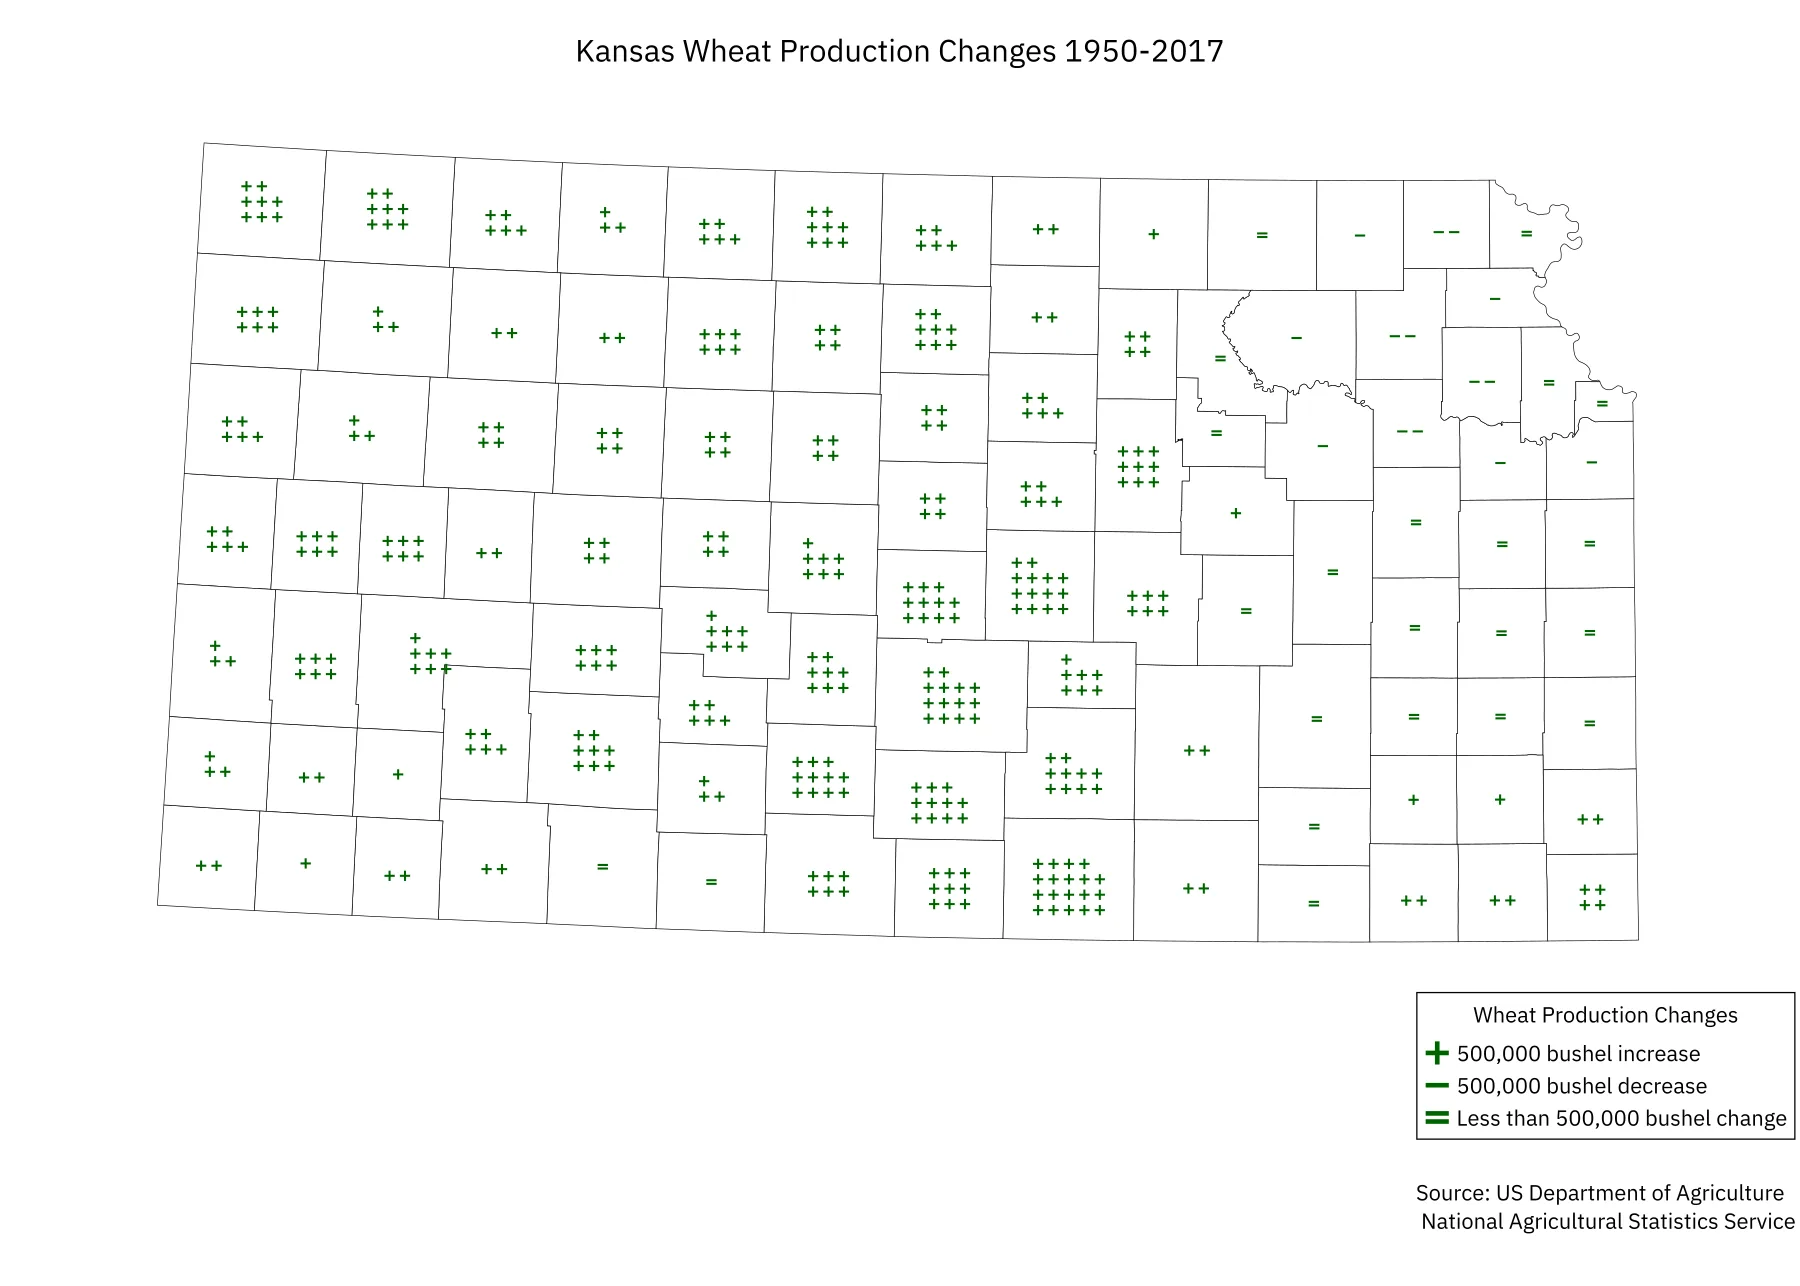
Dot Density Map ExampleOpen full size
Geo-referenced rasters
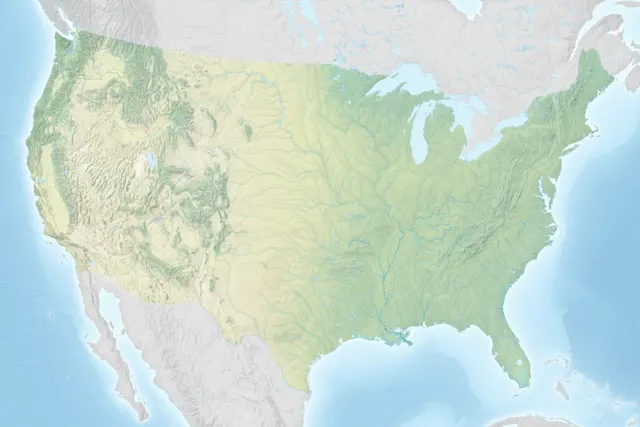
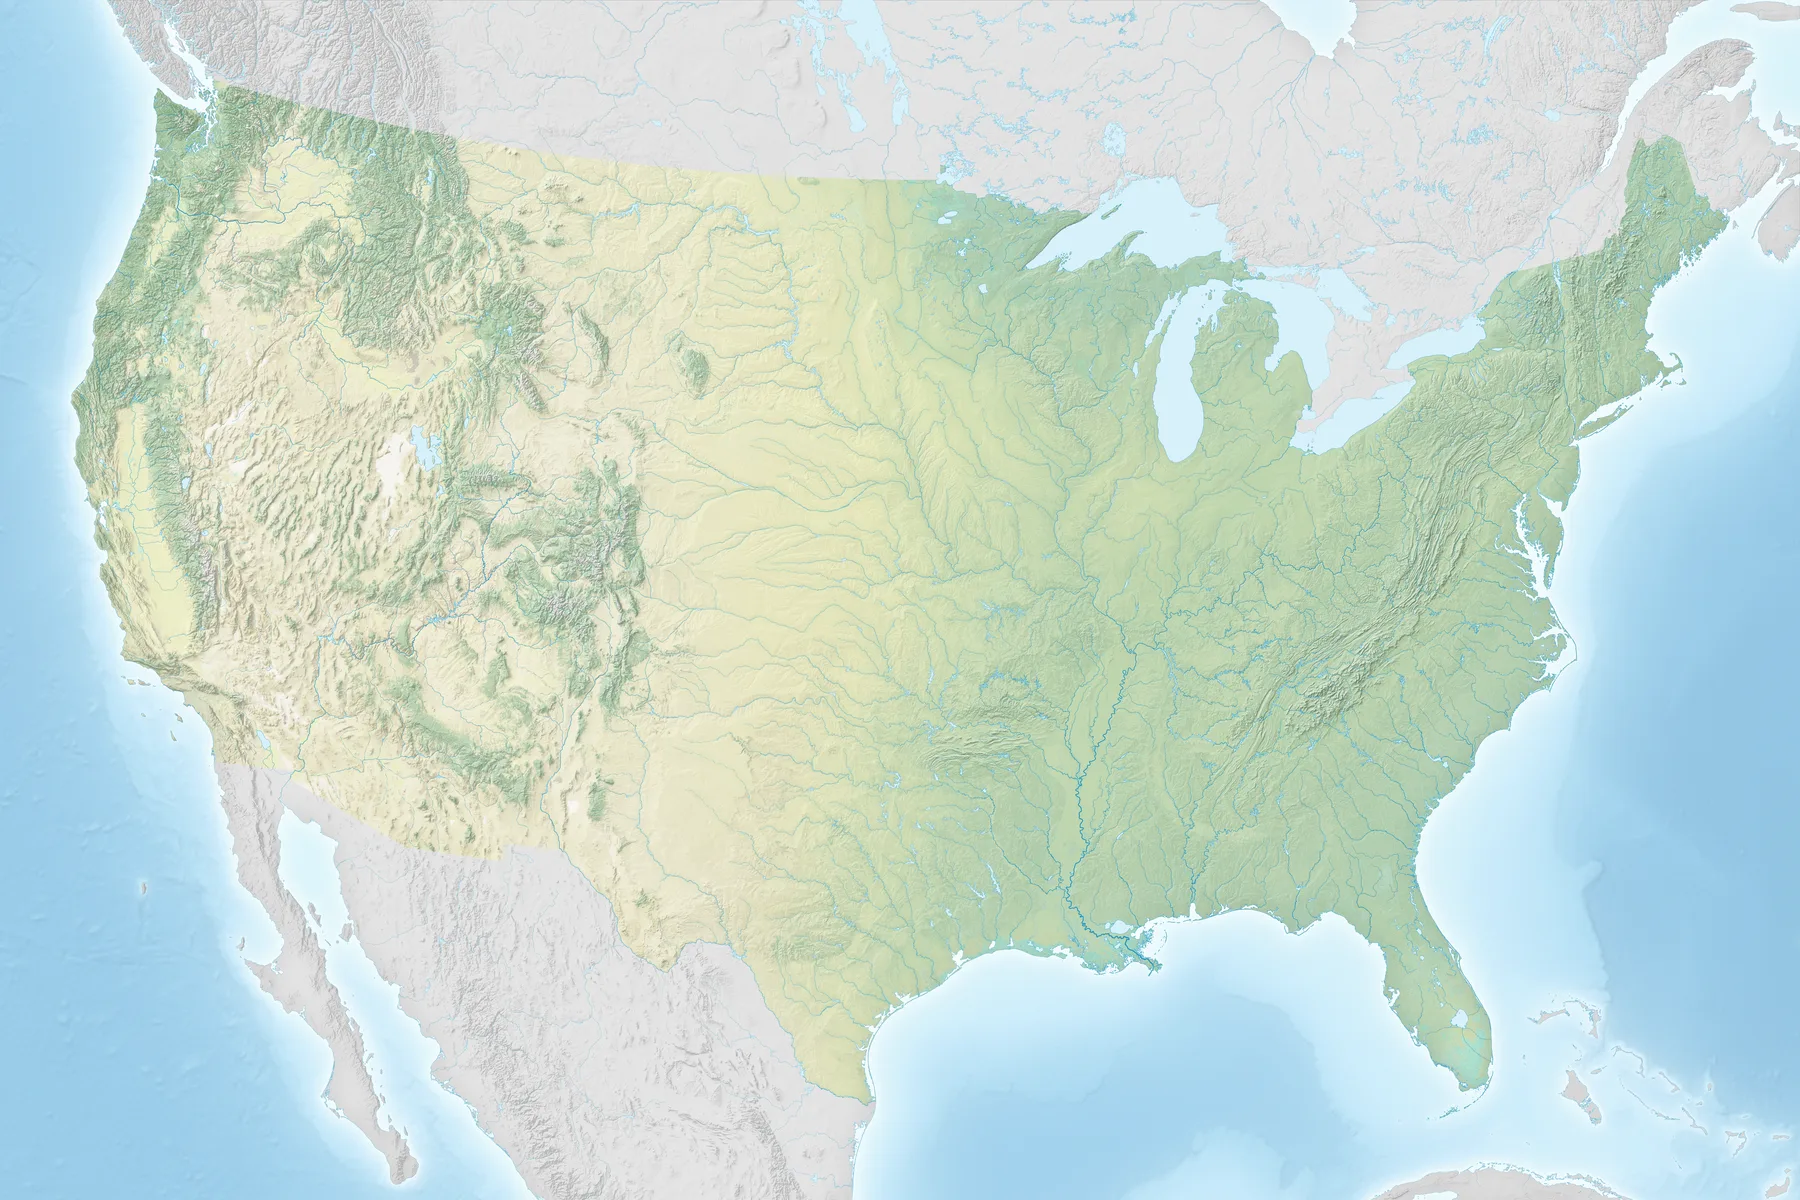
Shaded Relief MapOpen full size 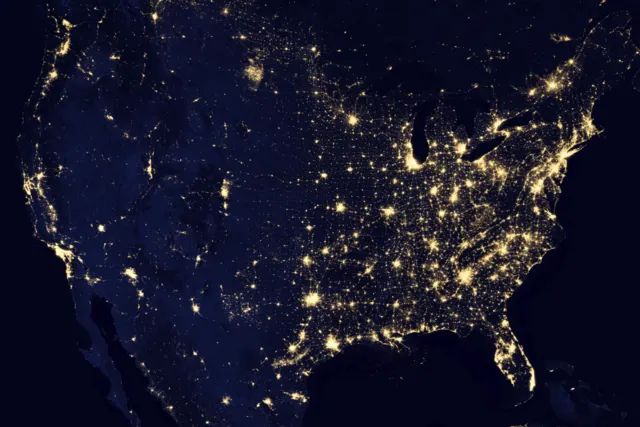
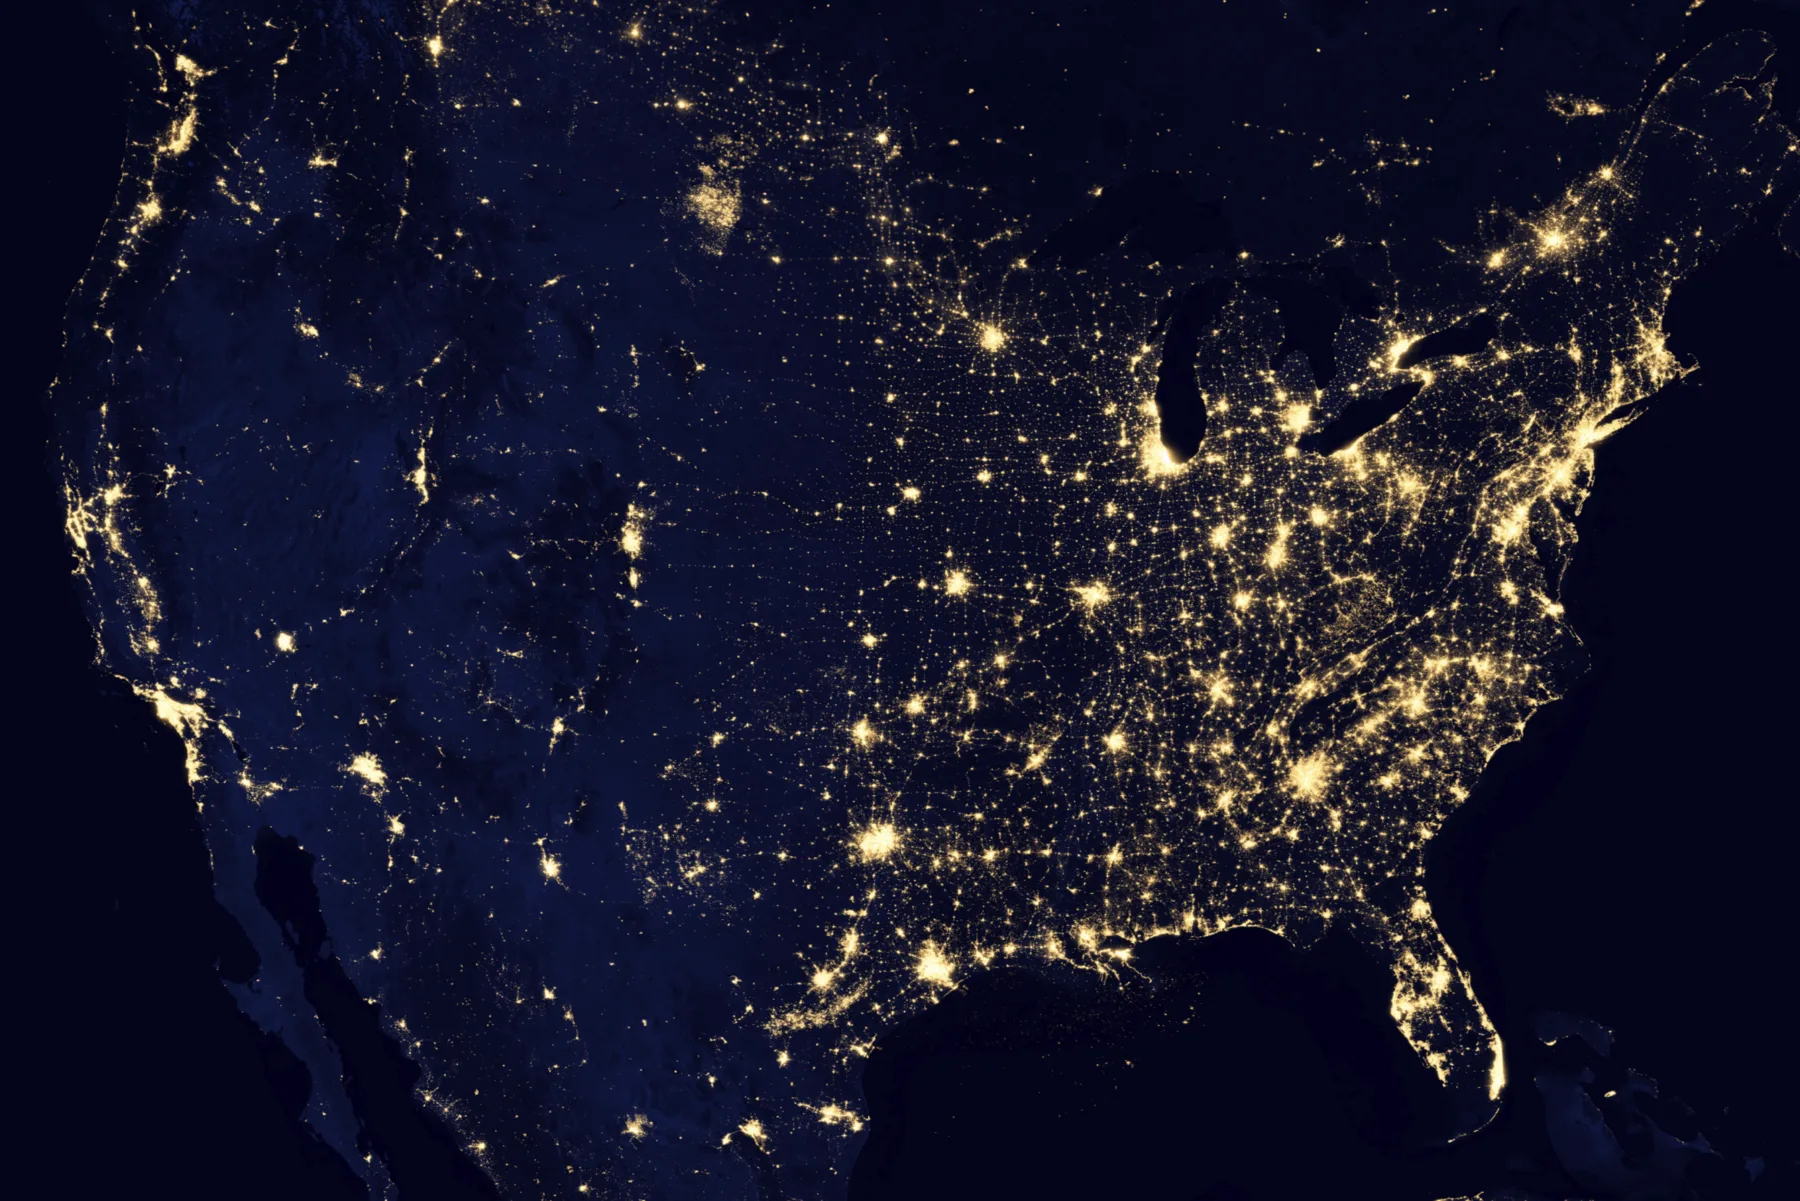
Contiguous US at NightOpen full size 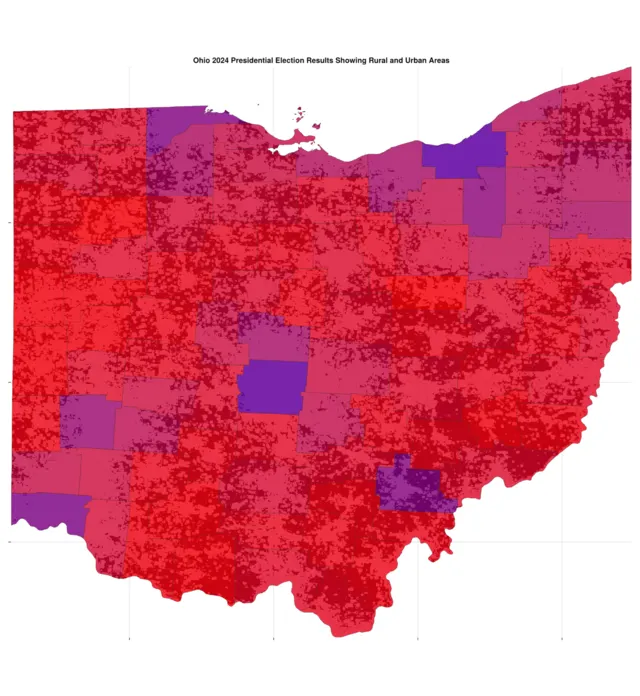
Example of a Geo-referenced Raster BackgroundOpen full size
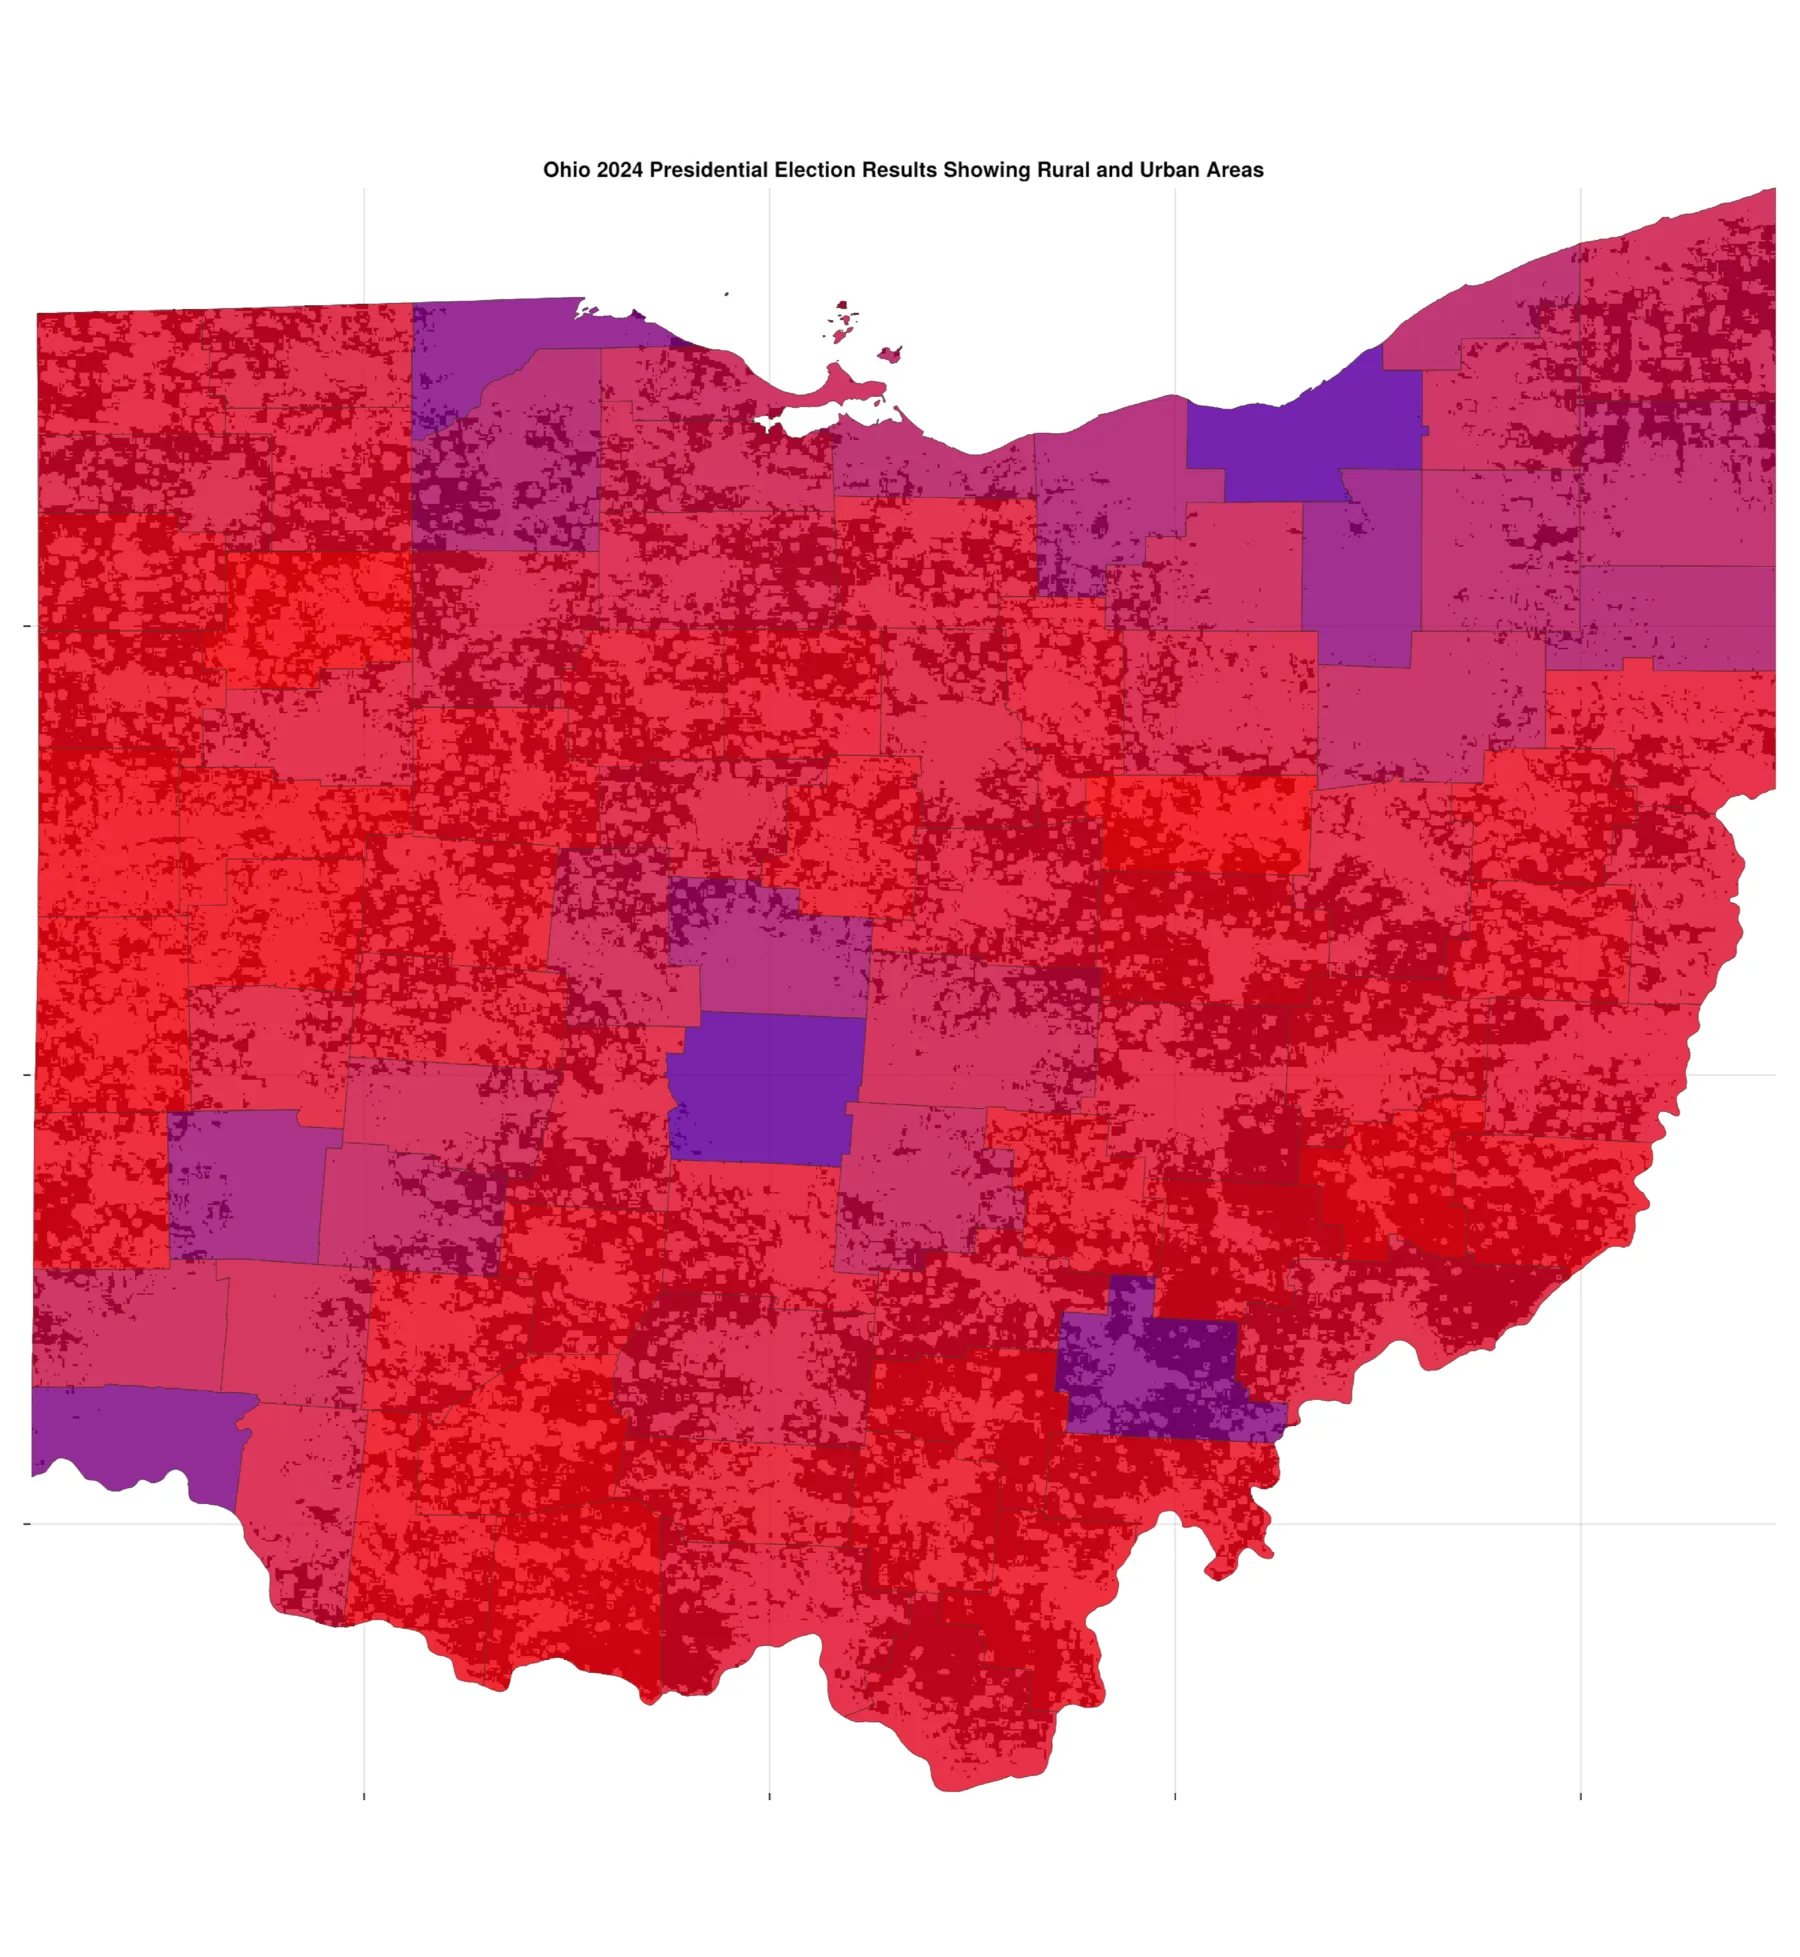
Catchment areas
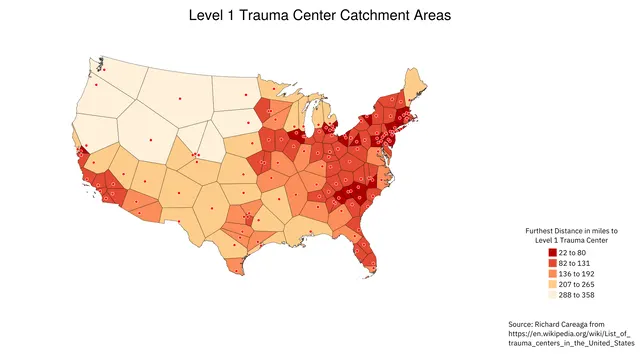
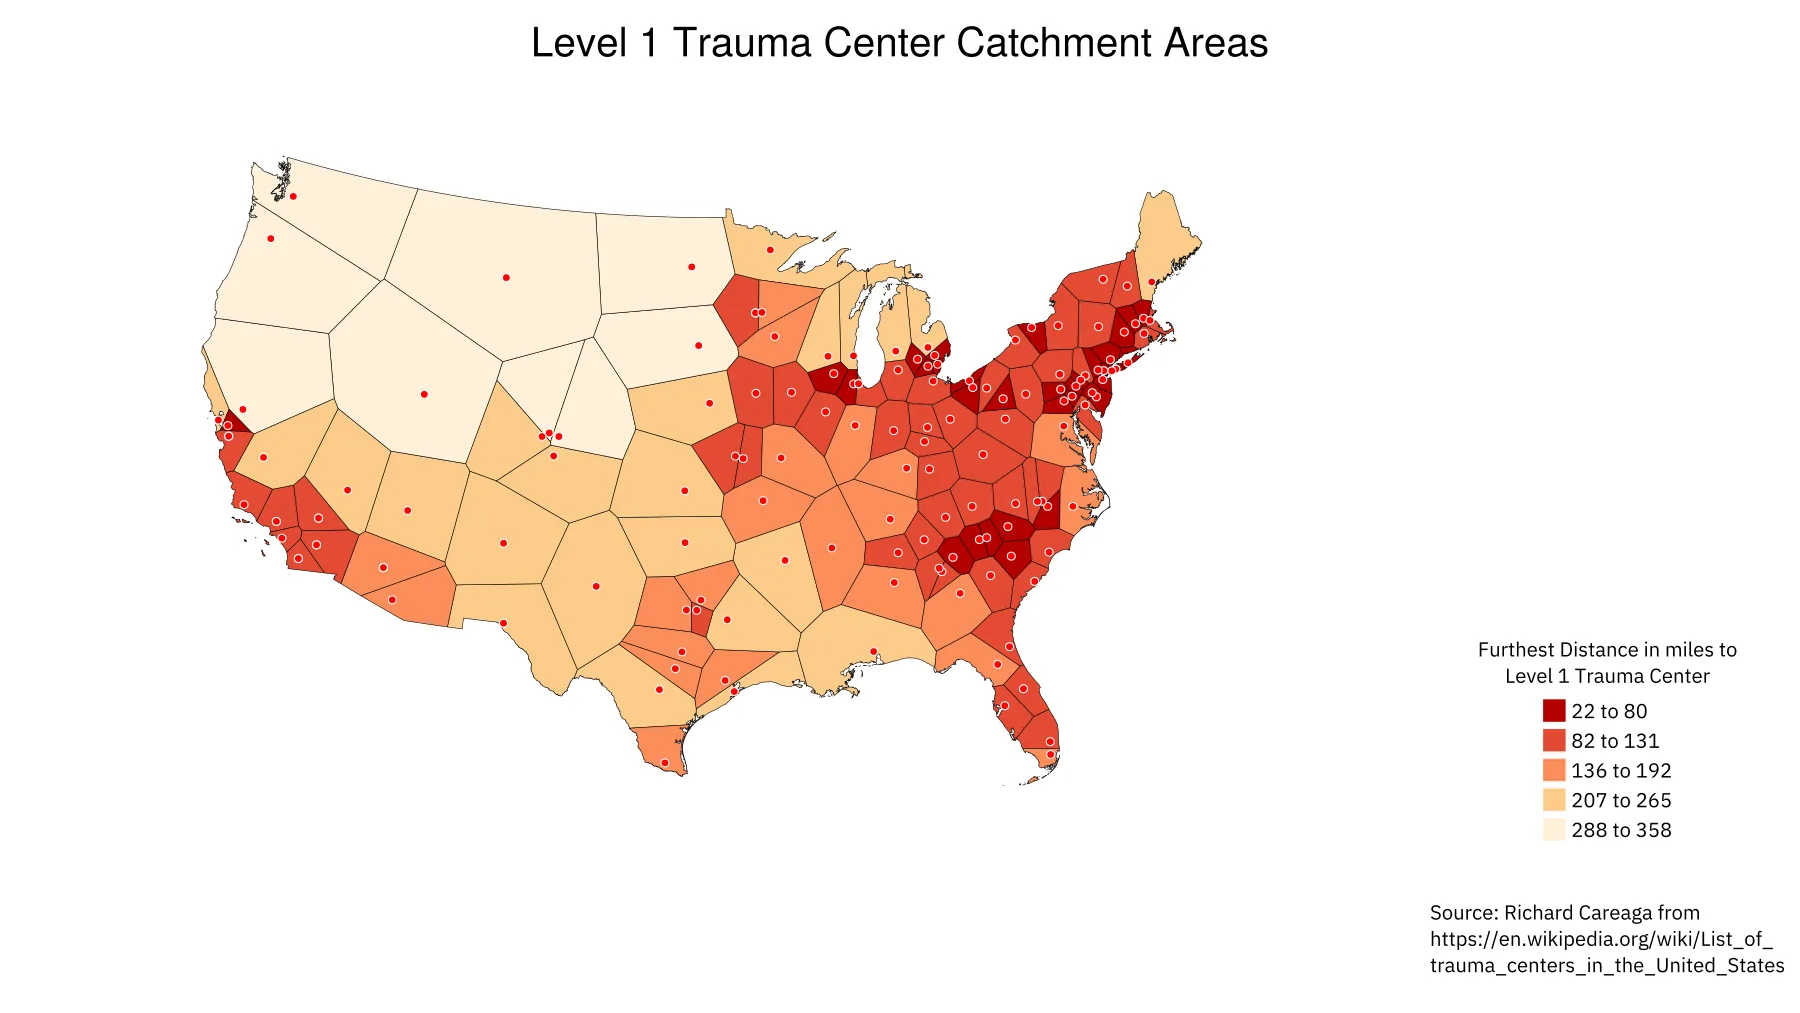
Example of Voronoi PlotOpen full size
Cartograms
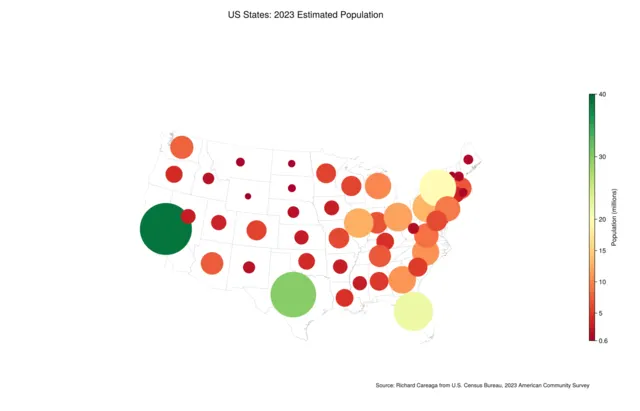
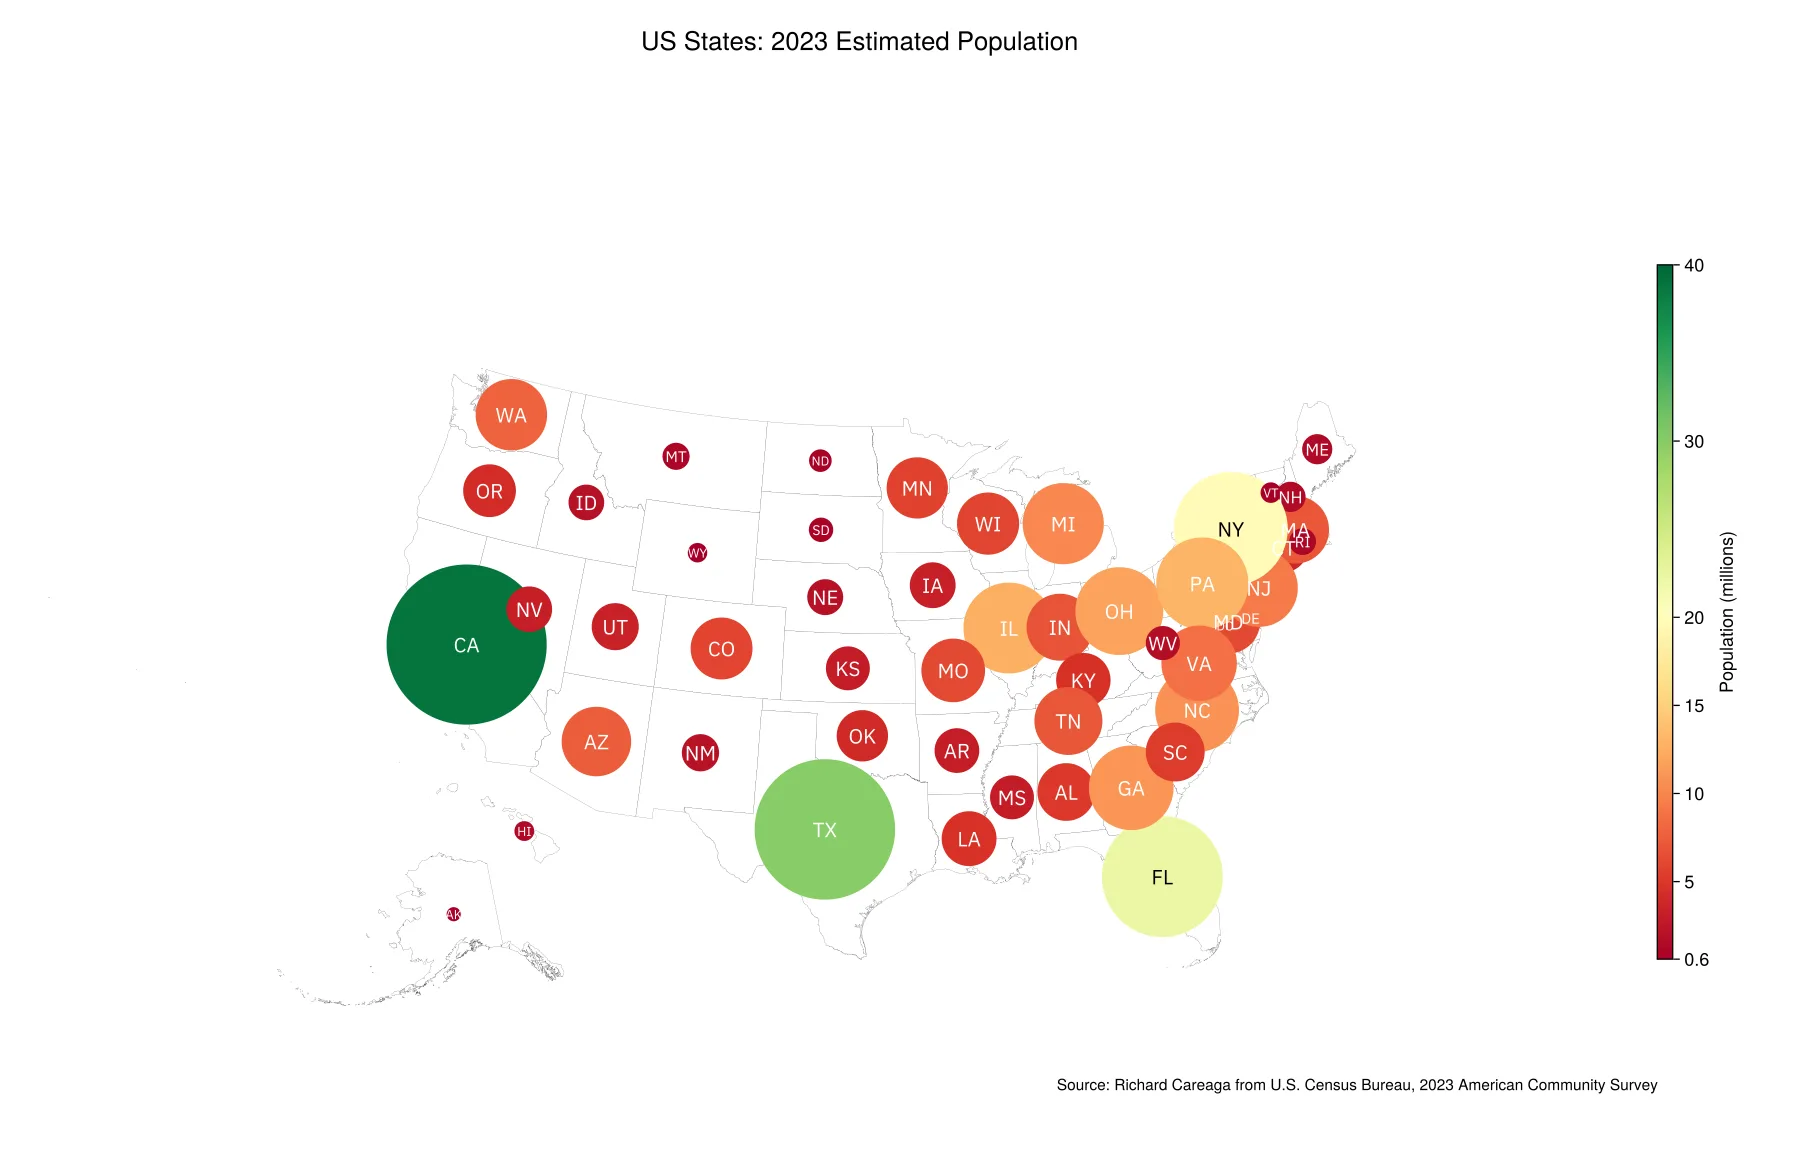
Bubble ChartOpen full size 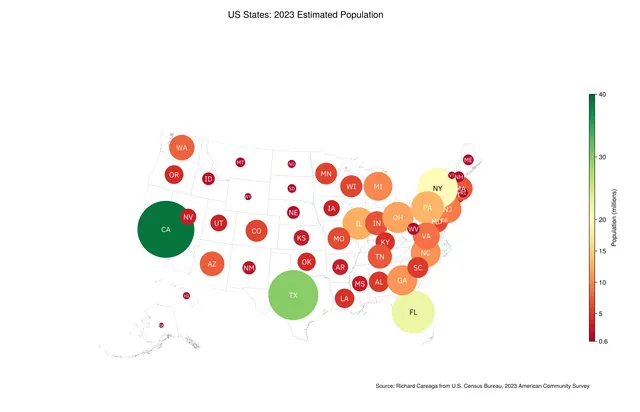
Bubble ChartOpen full size 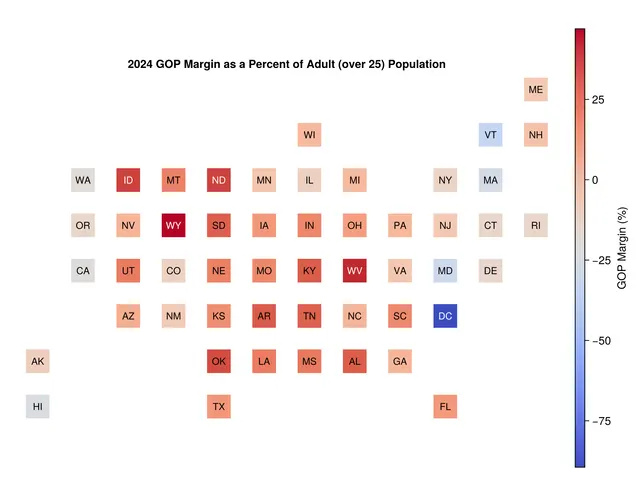
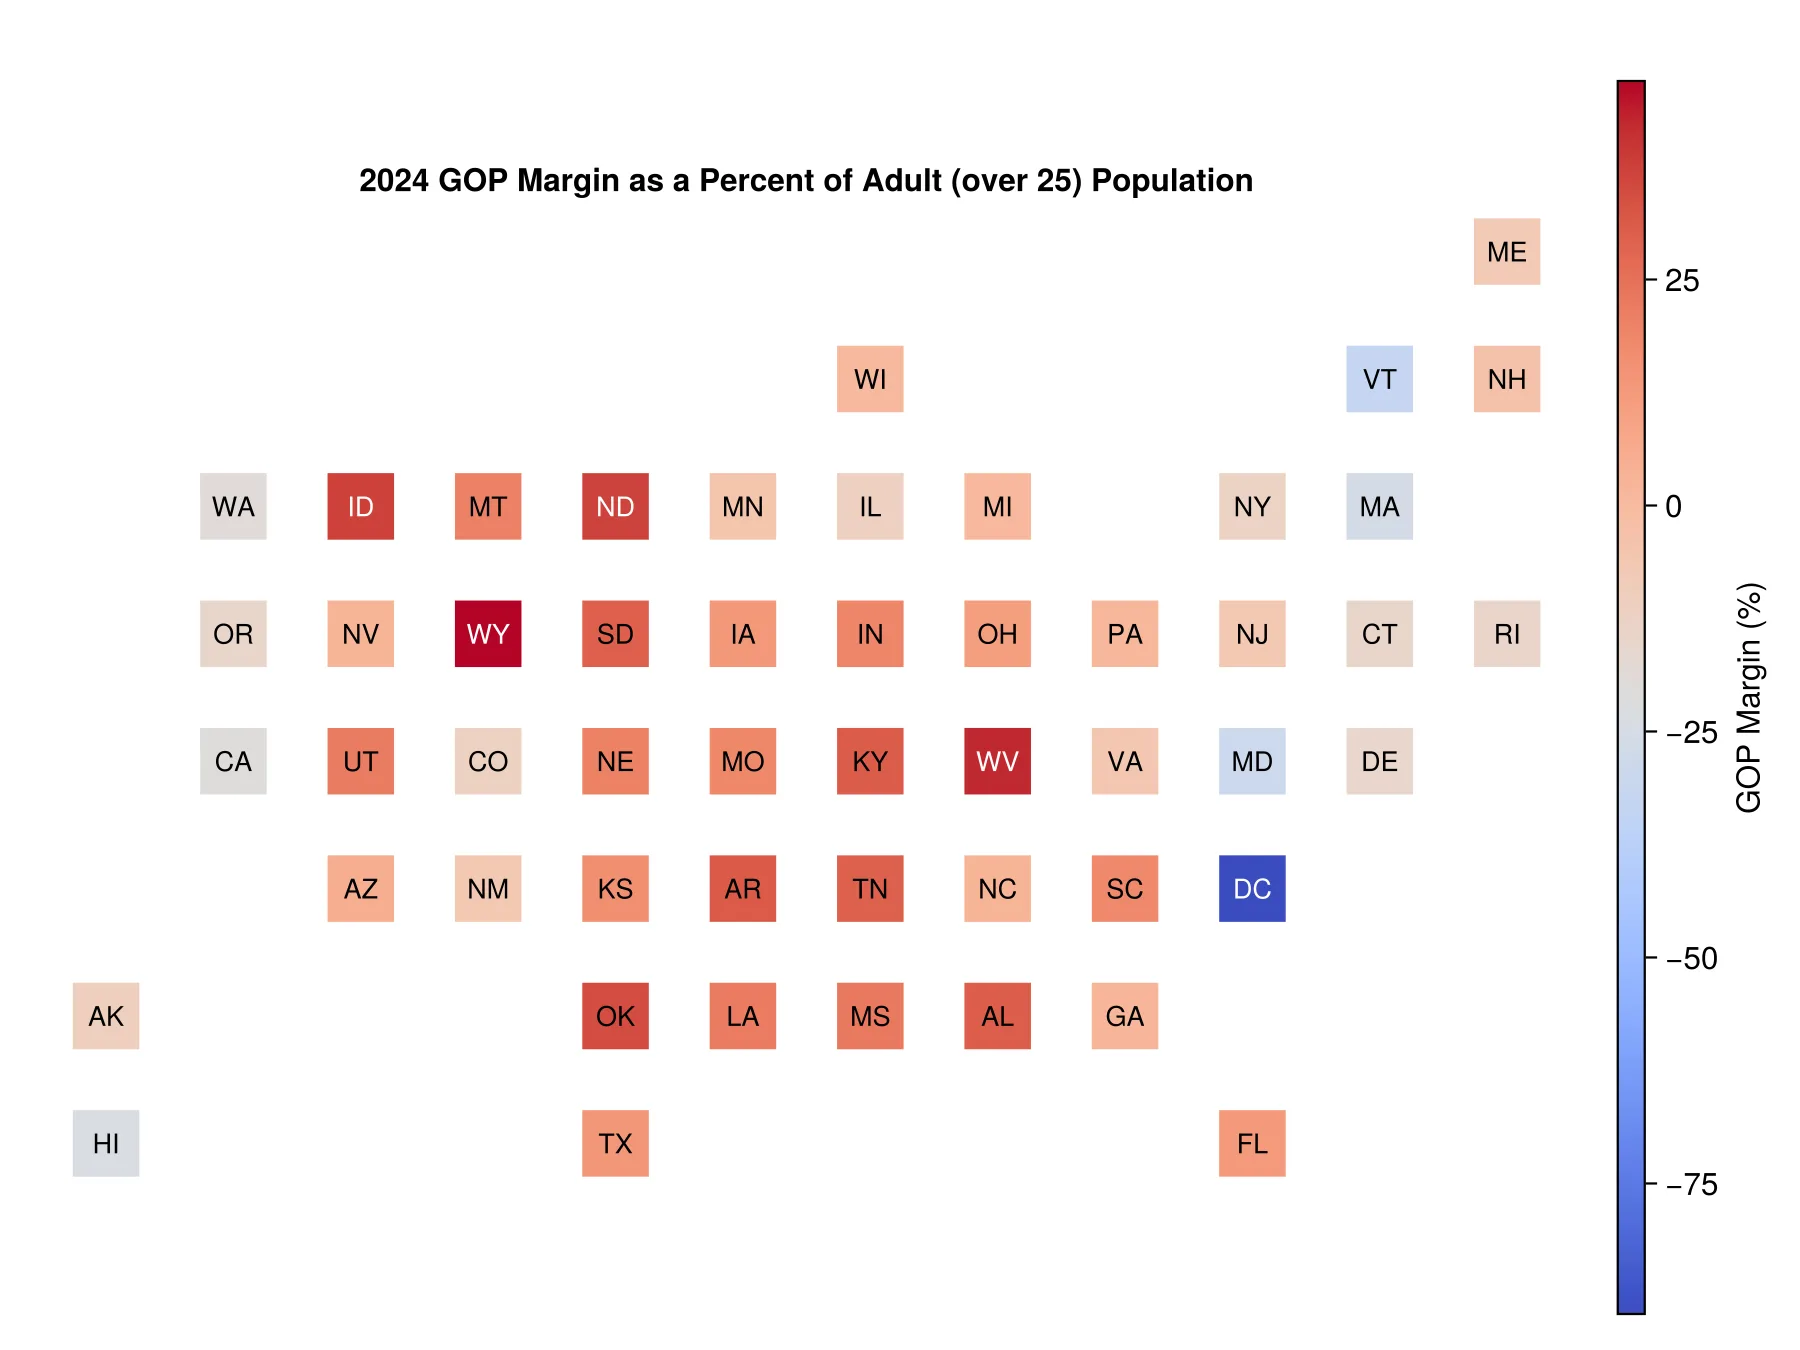
Example of a Bin Plot CartogramOpen full size 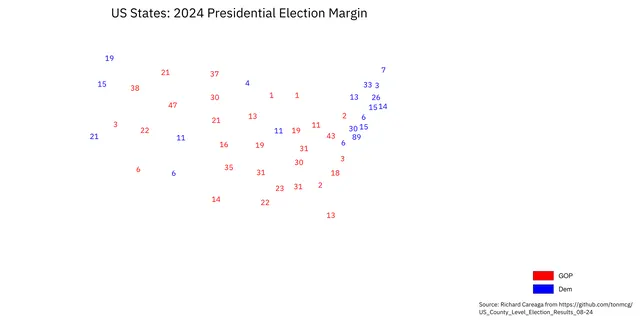
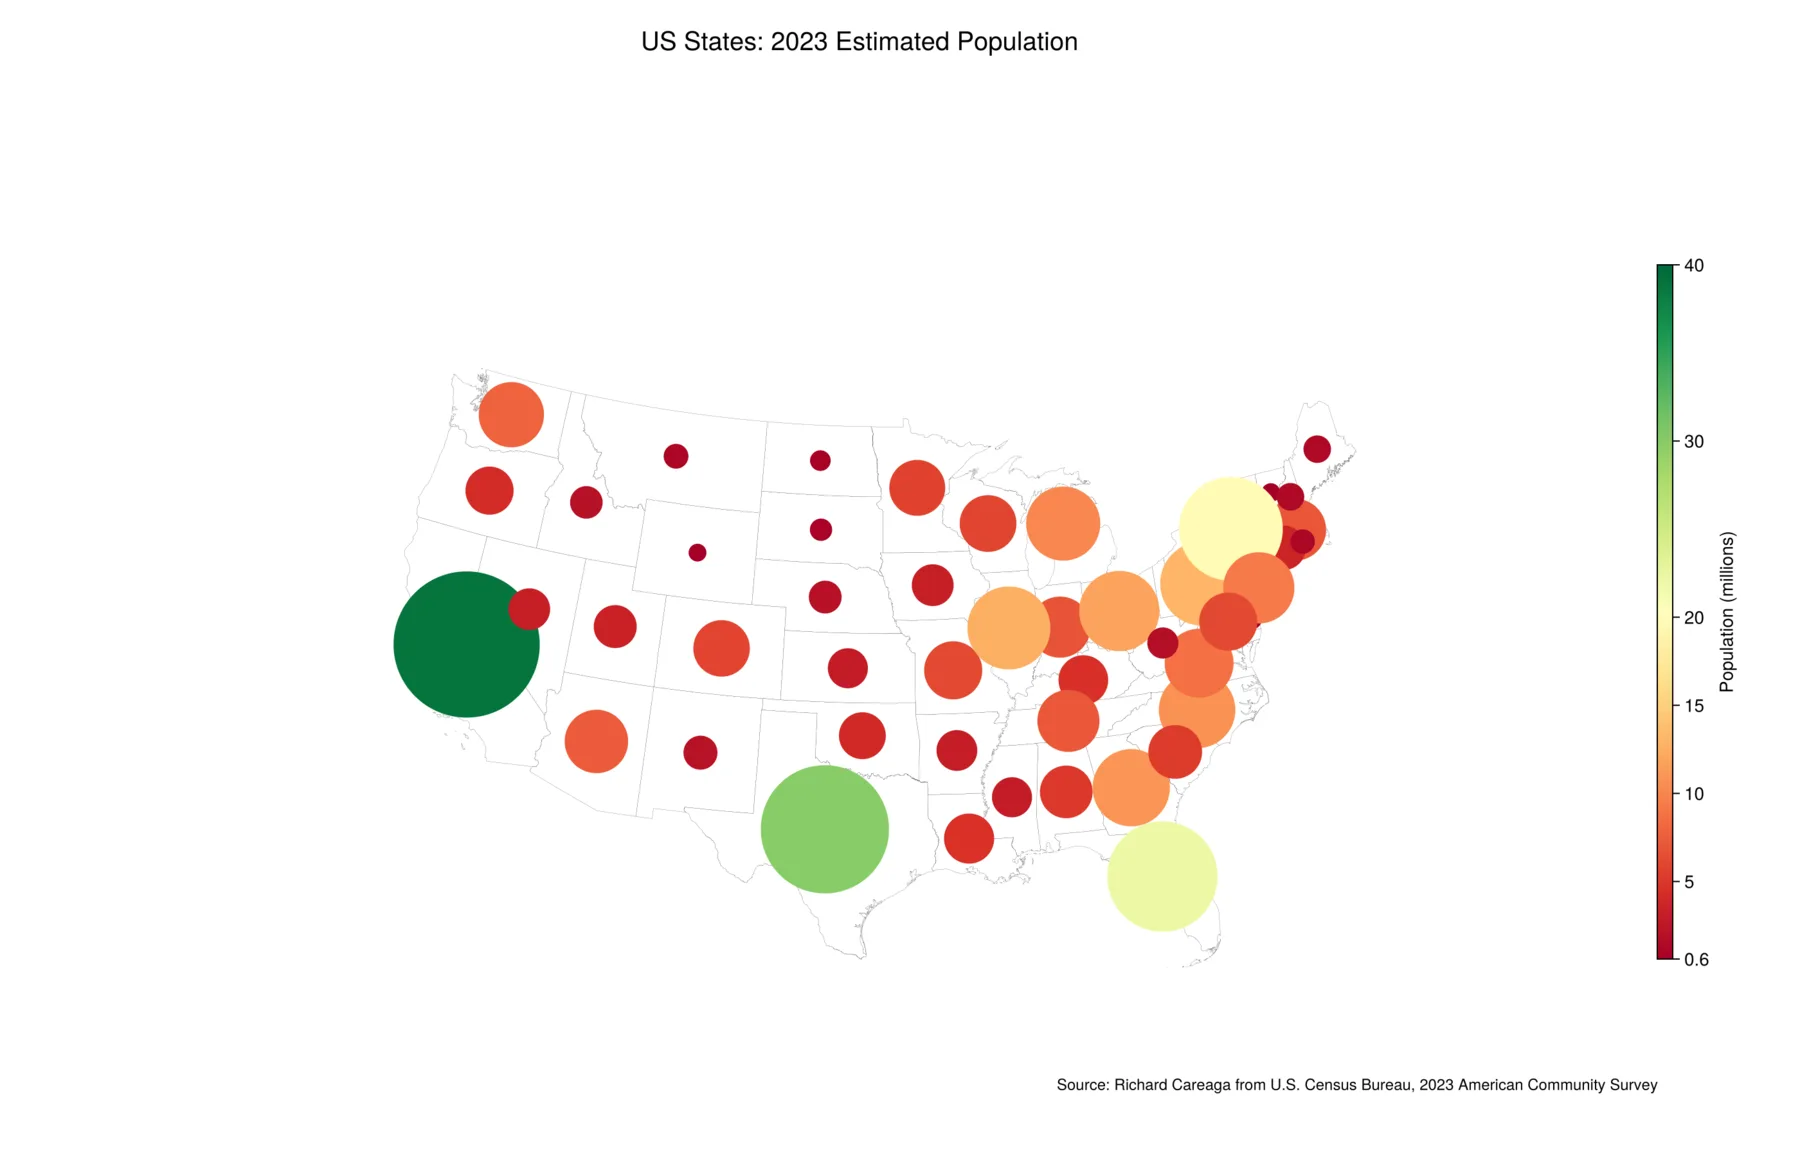
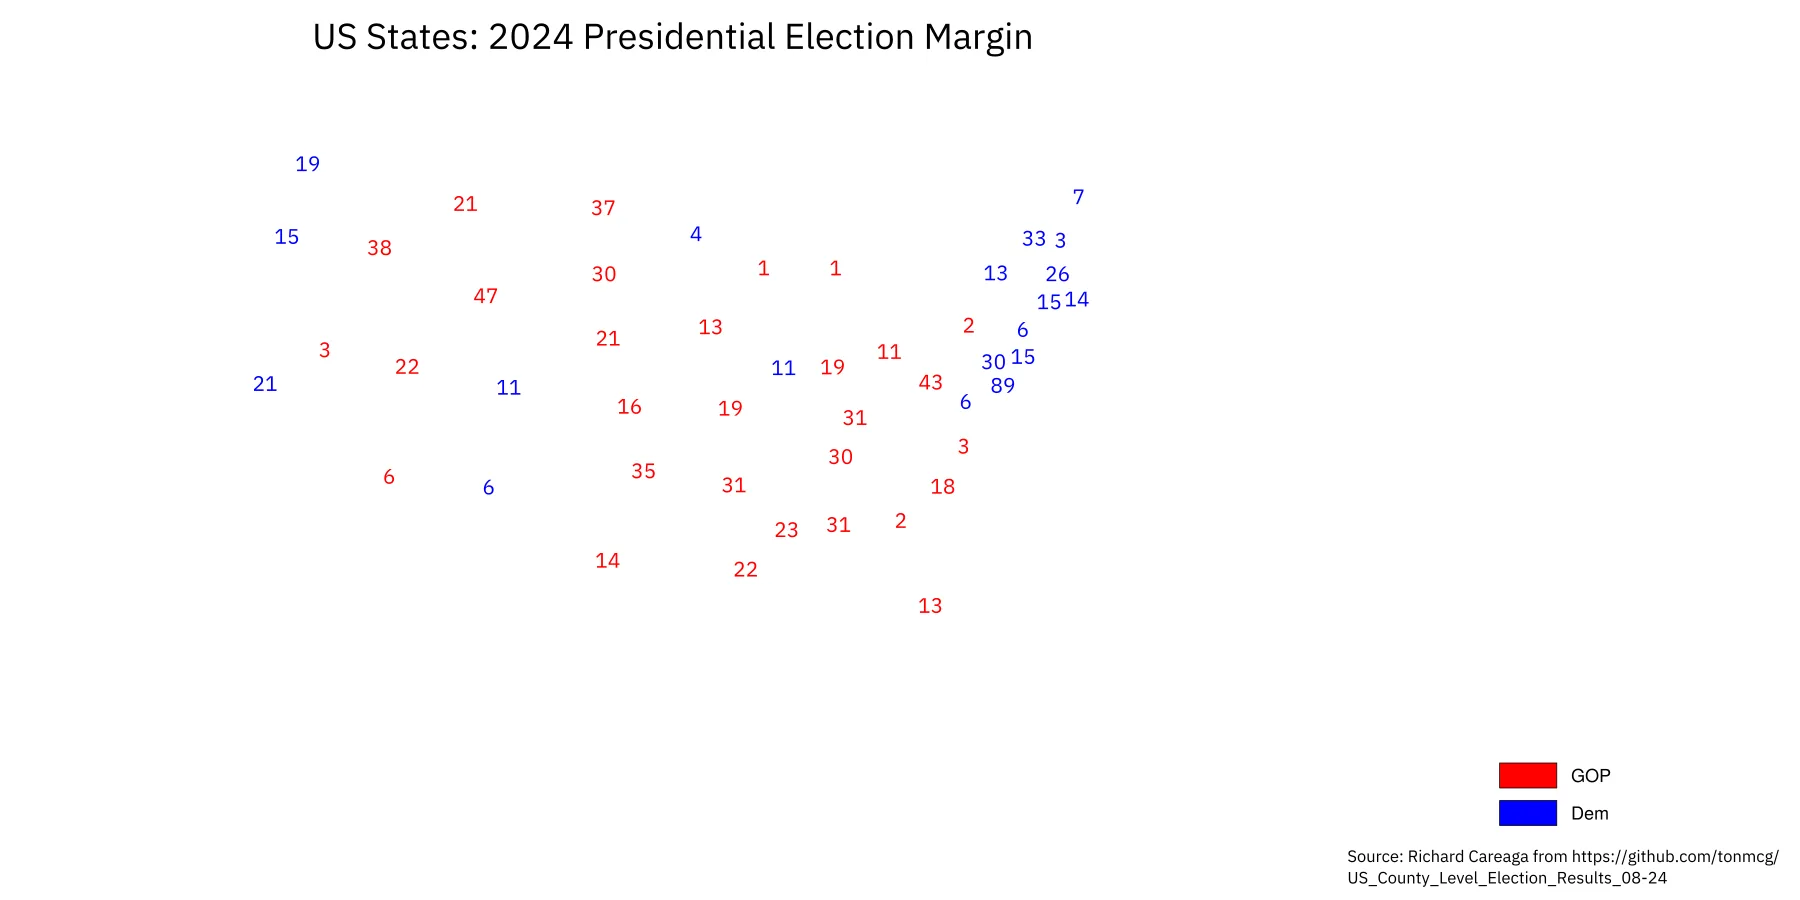
Symbolic Cartogram ExampleOpen full size
Small multiples
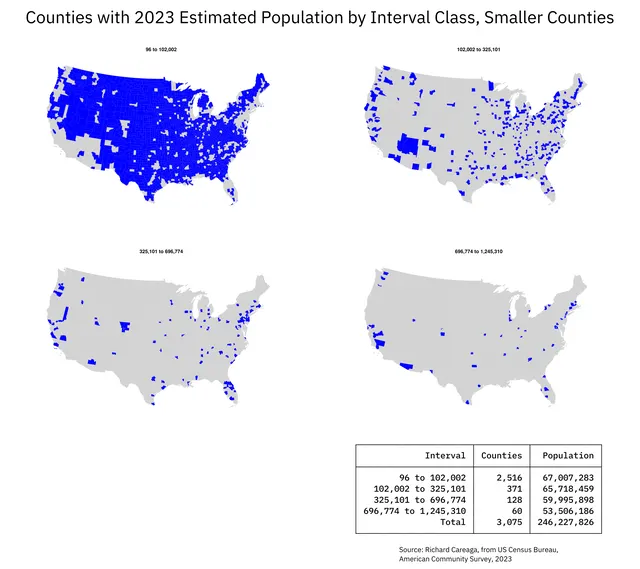
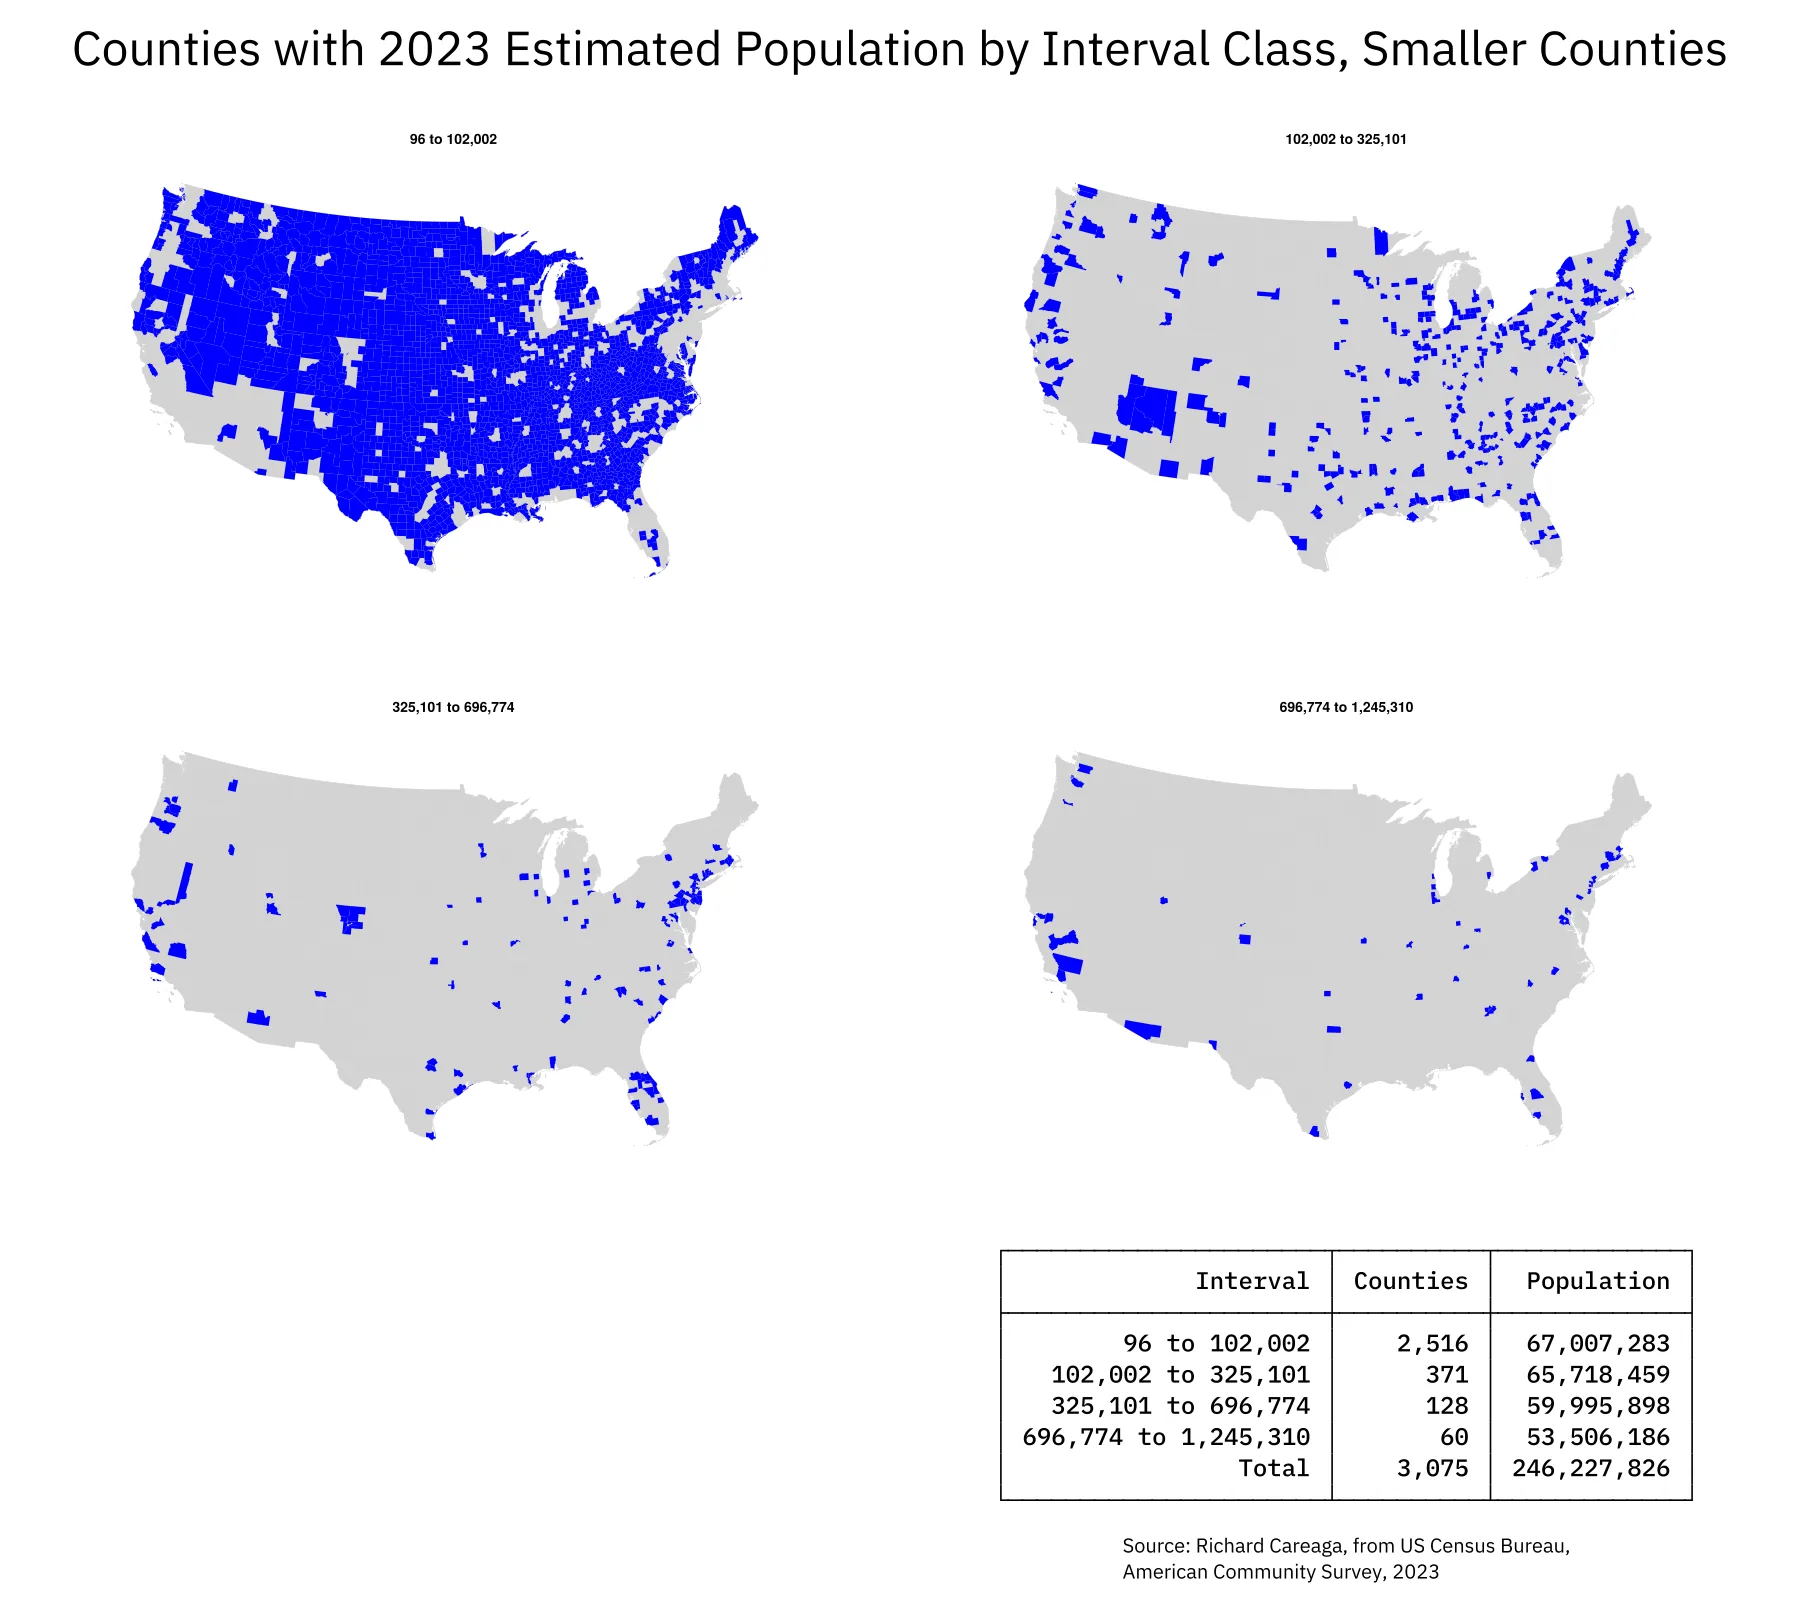
Small Multiples Map IllustrationOpen full size
Spatial reasoning
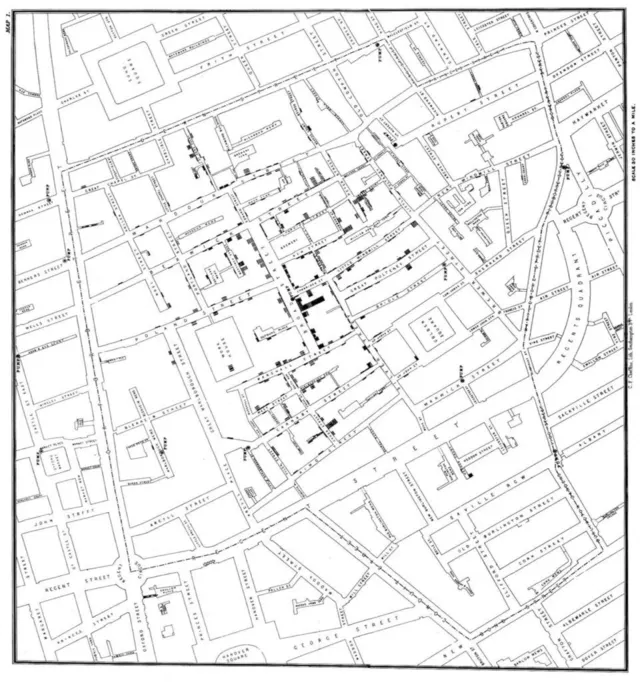
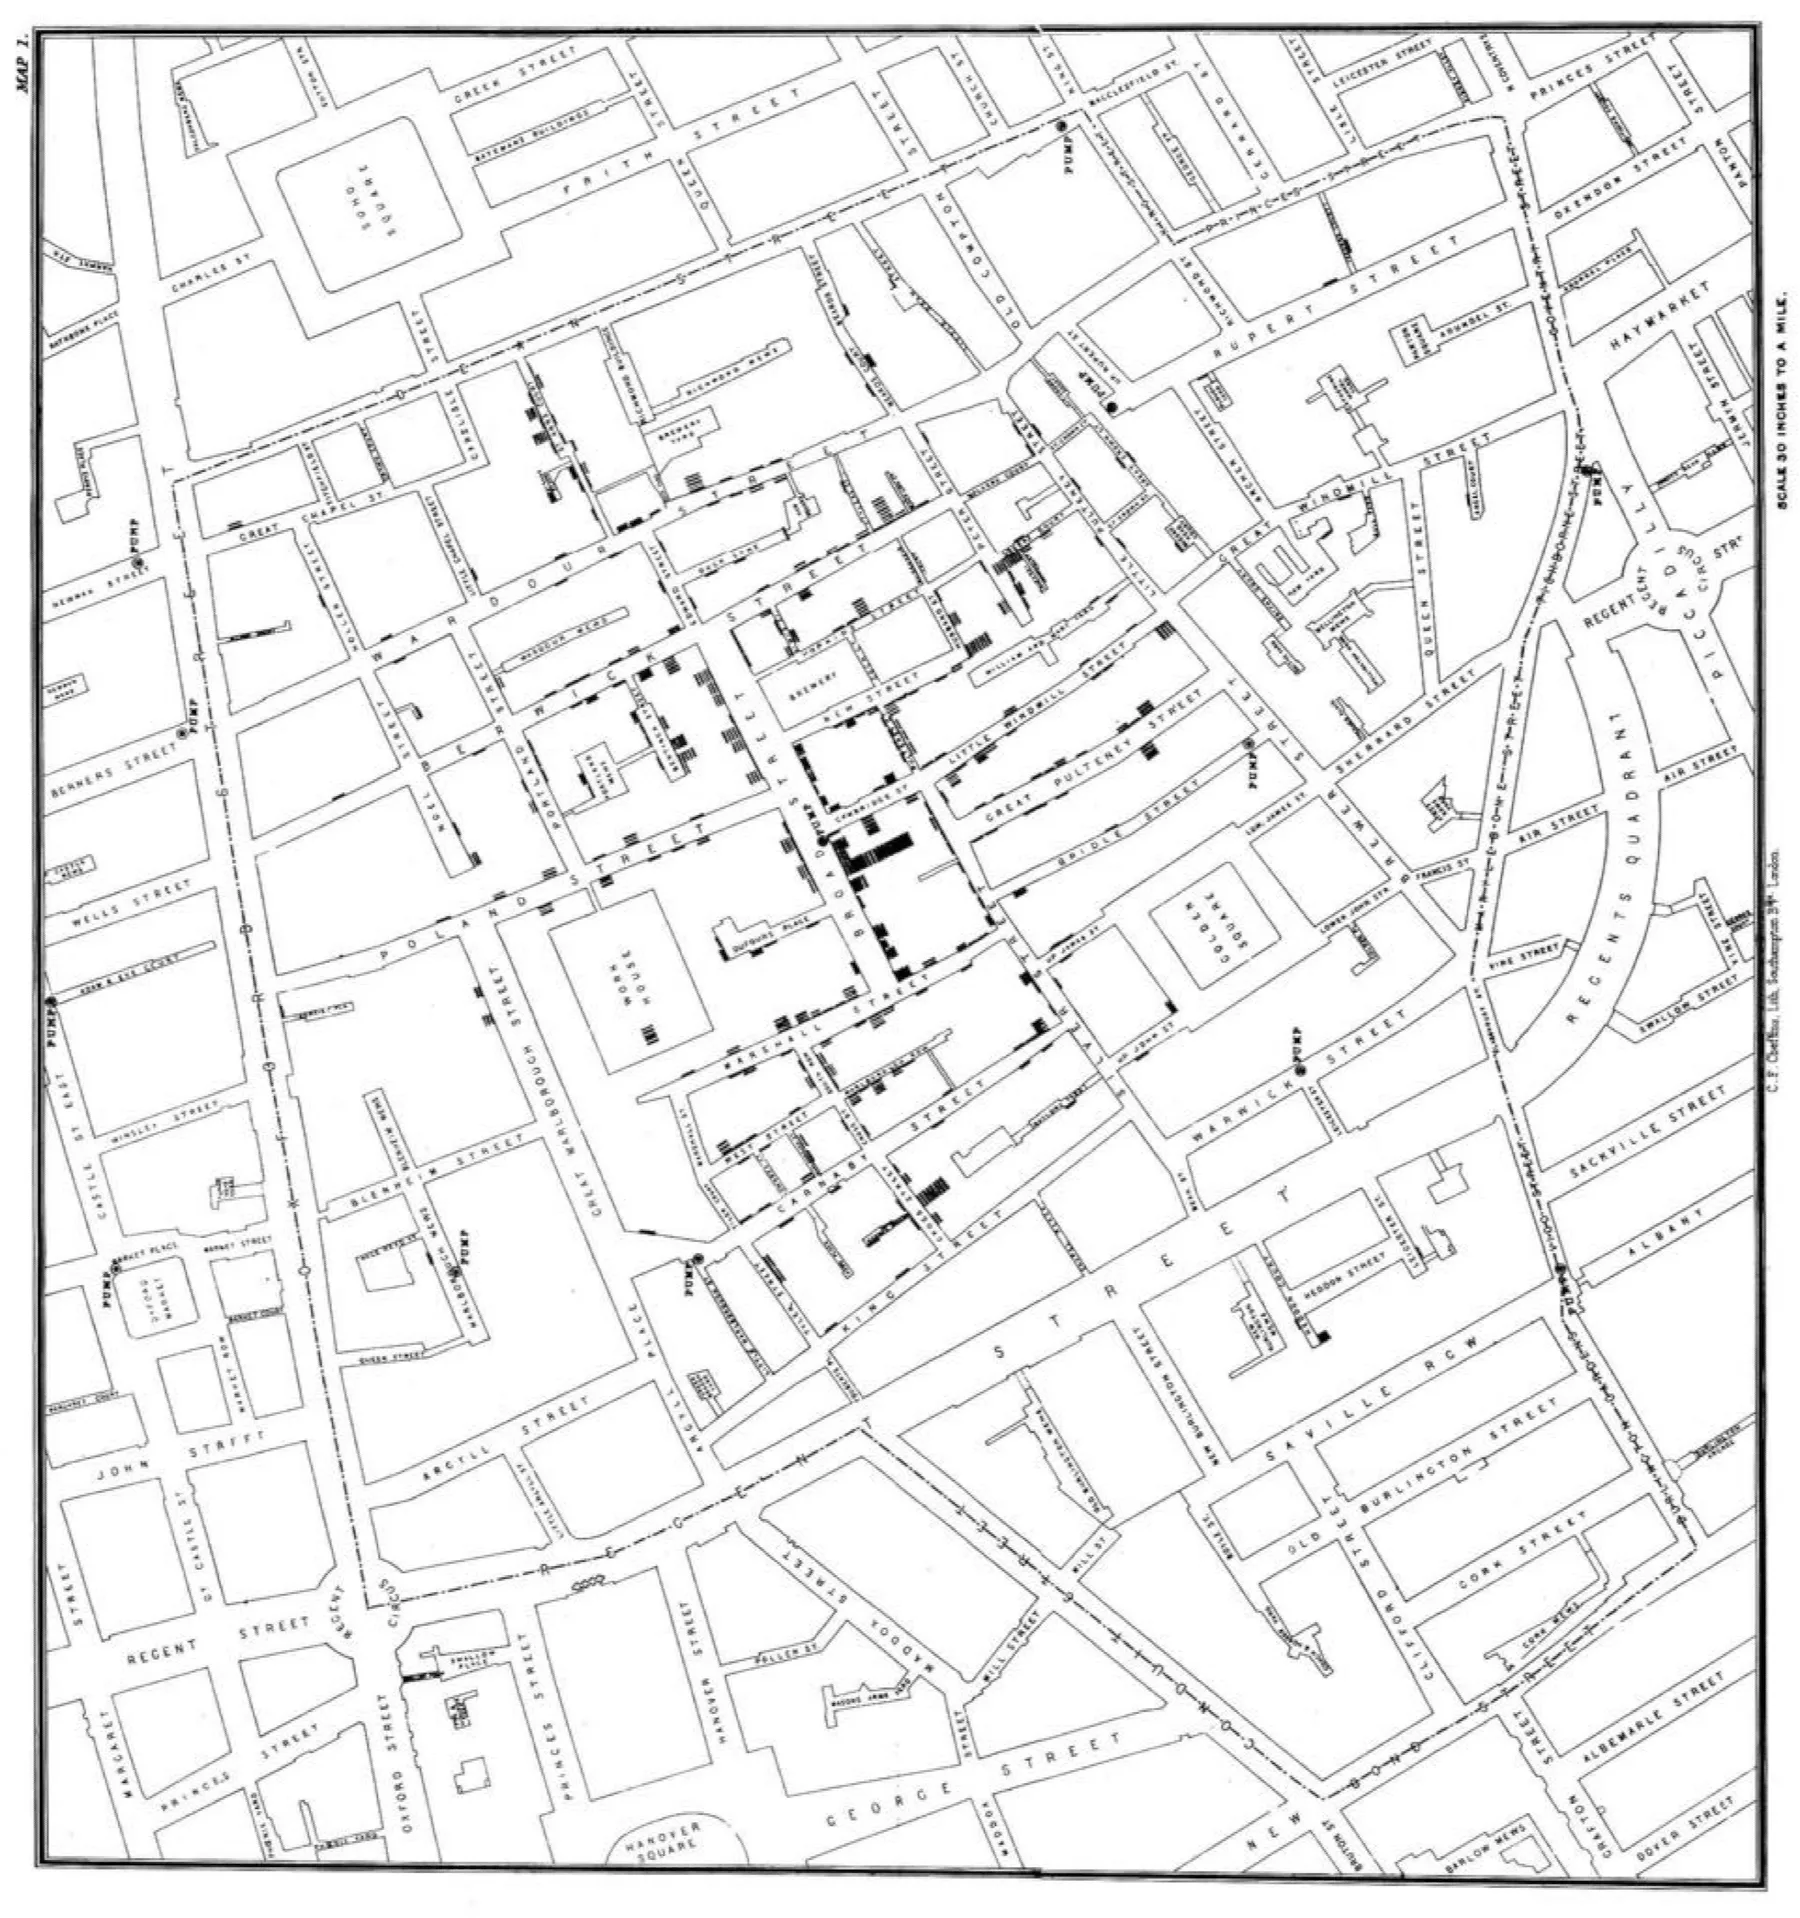
John Snow's Map of the Golden Square Cholera OutbreakOpen full size 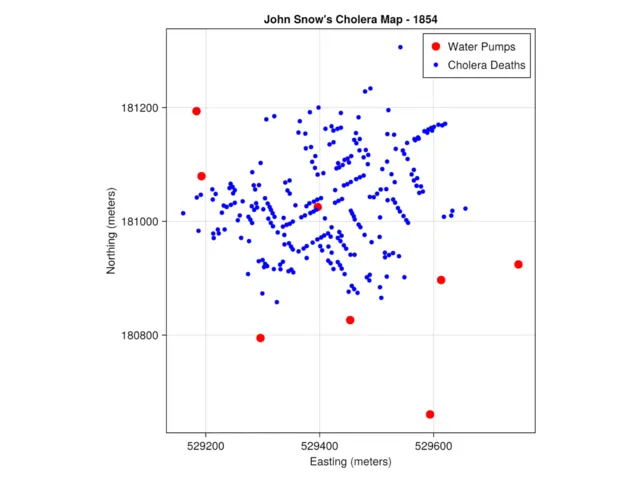
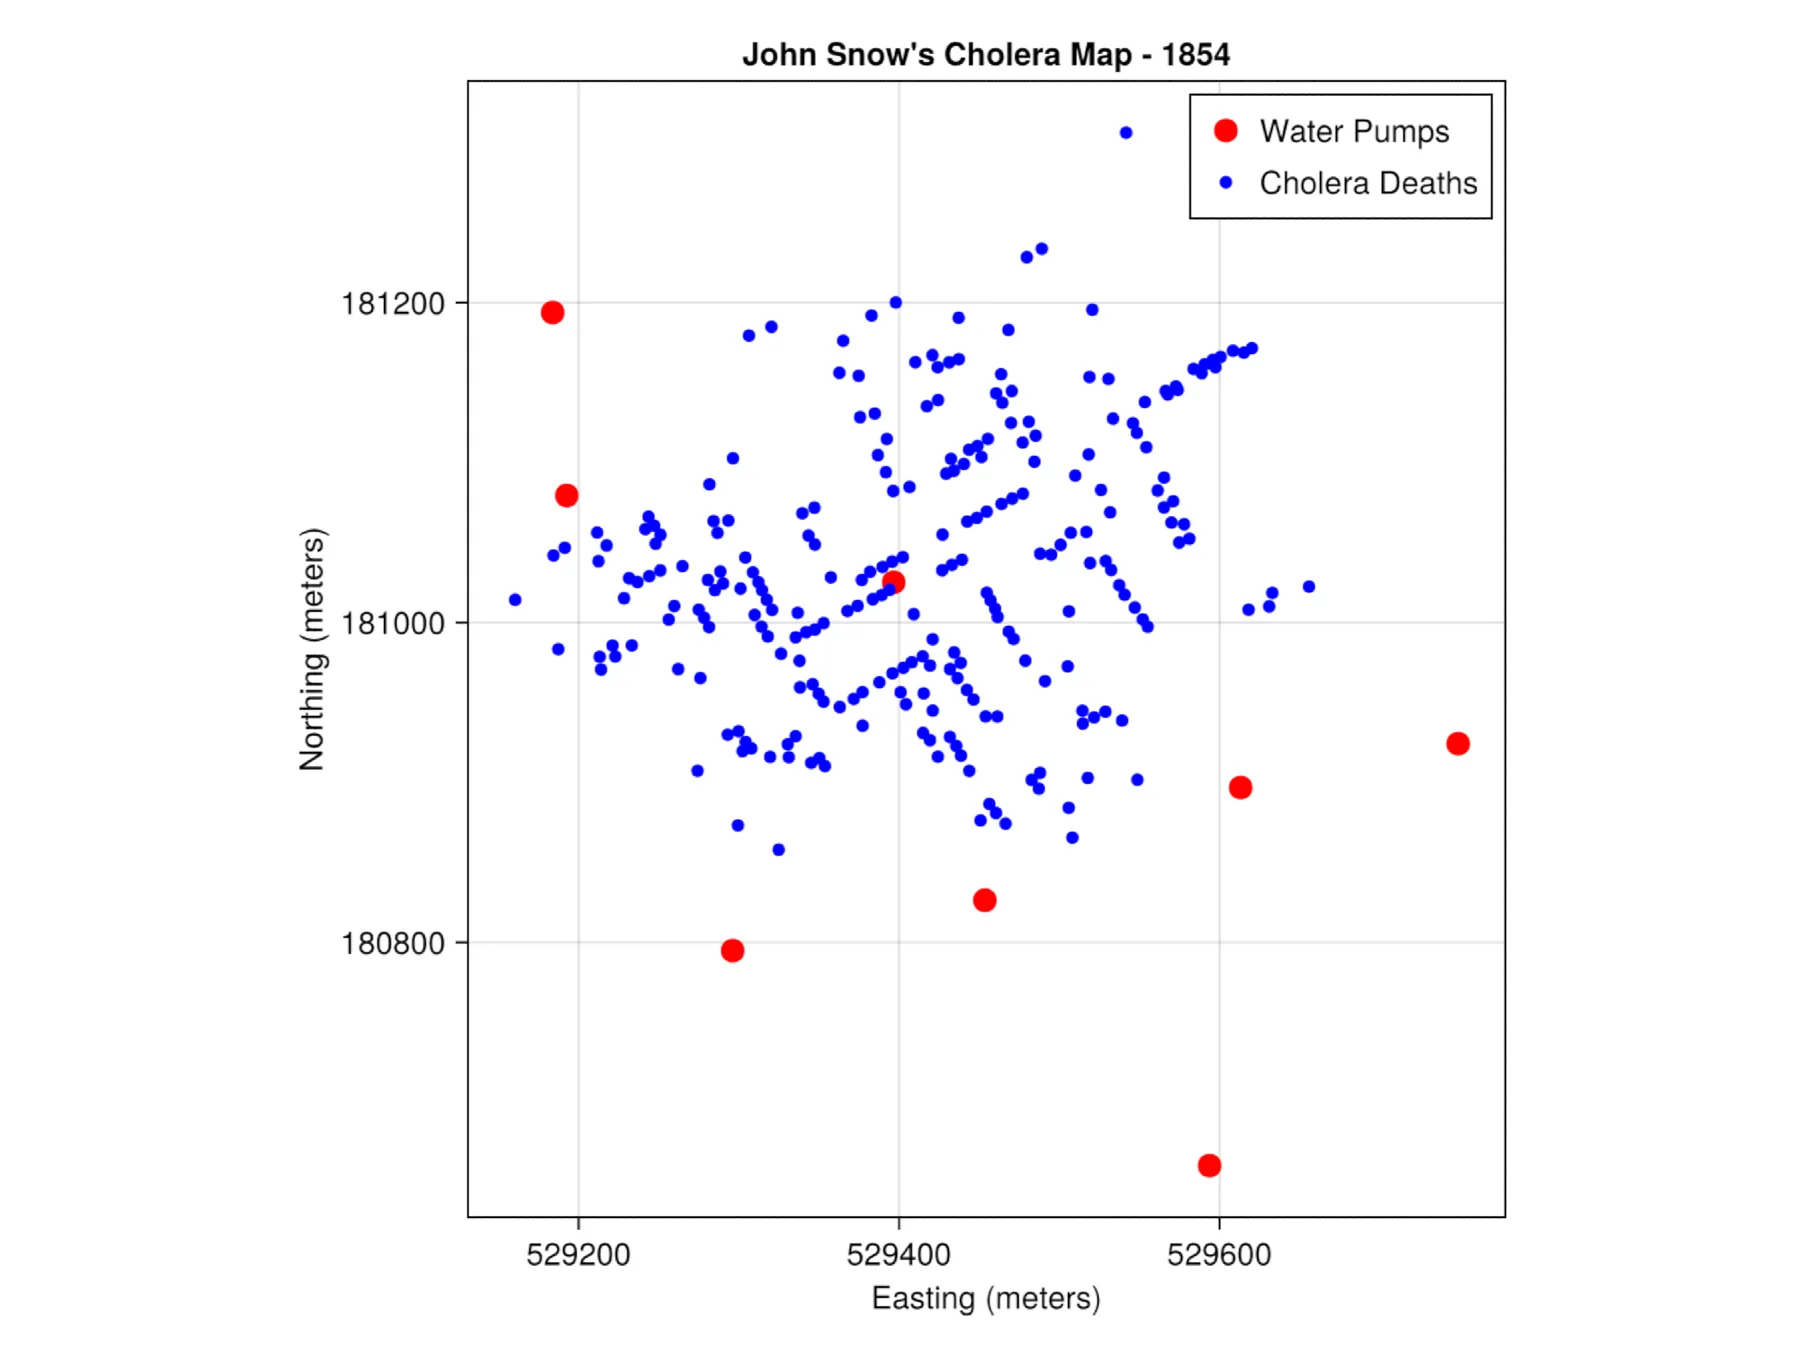
Stylizyed Map of Cholora DeathsOpen full size 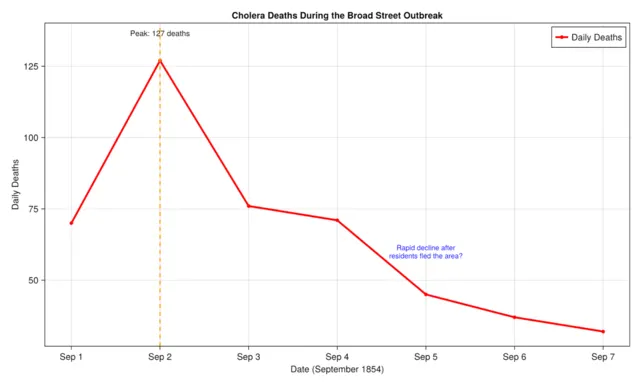
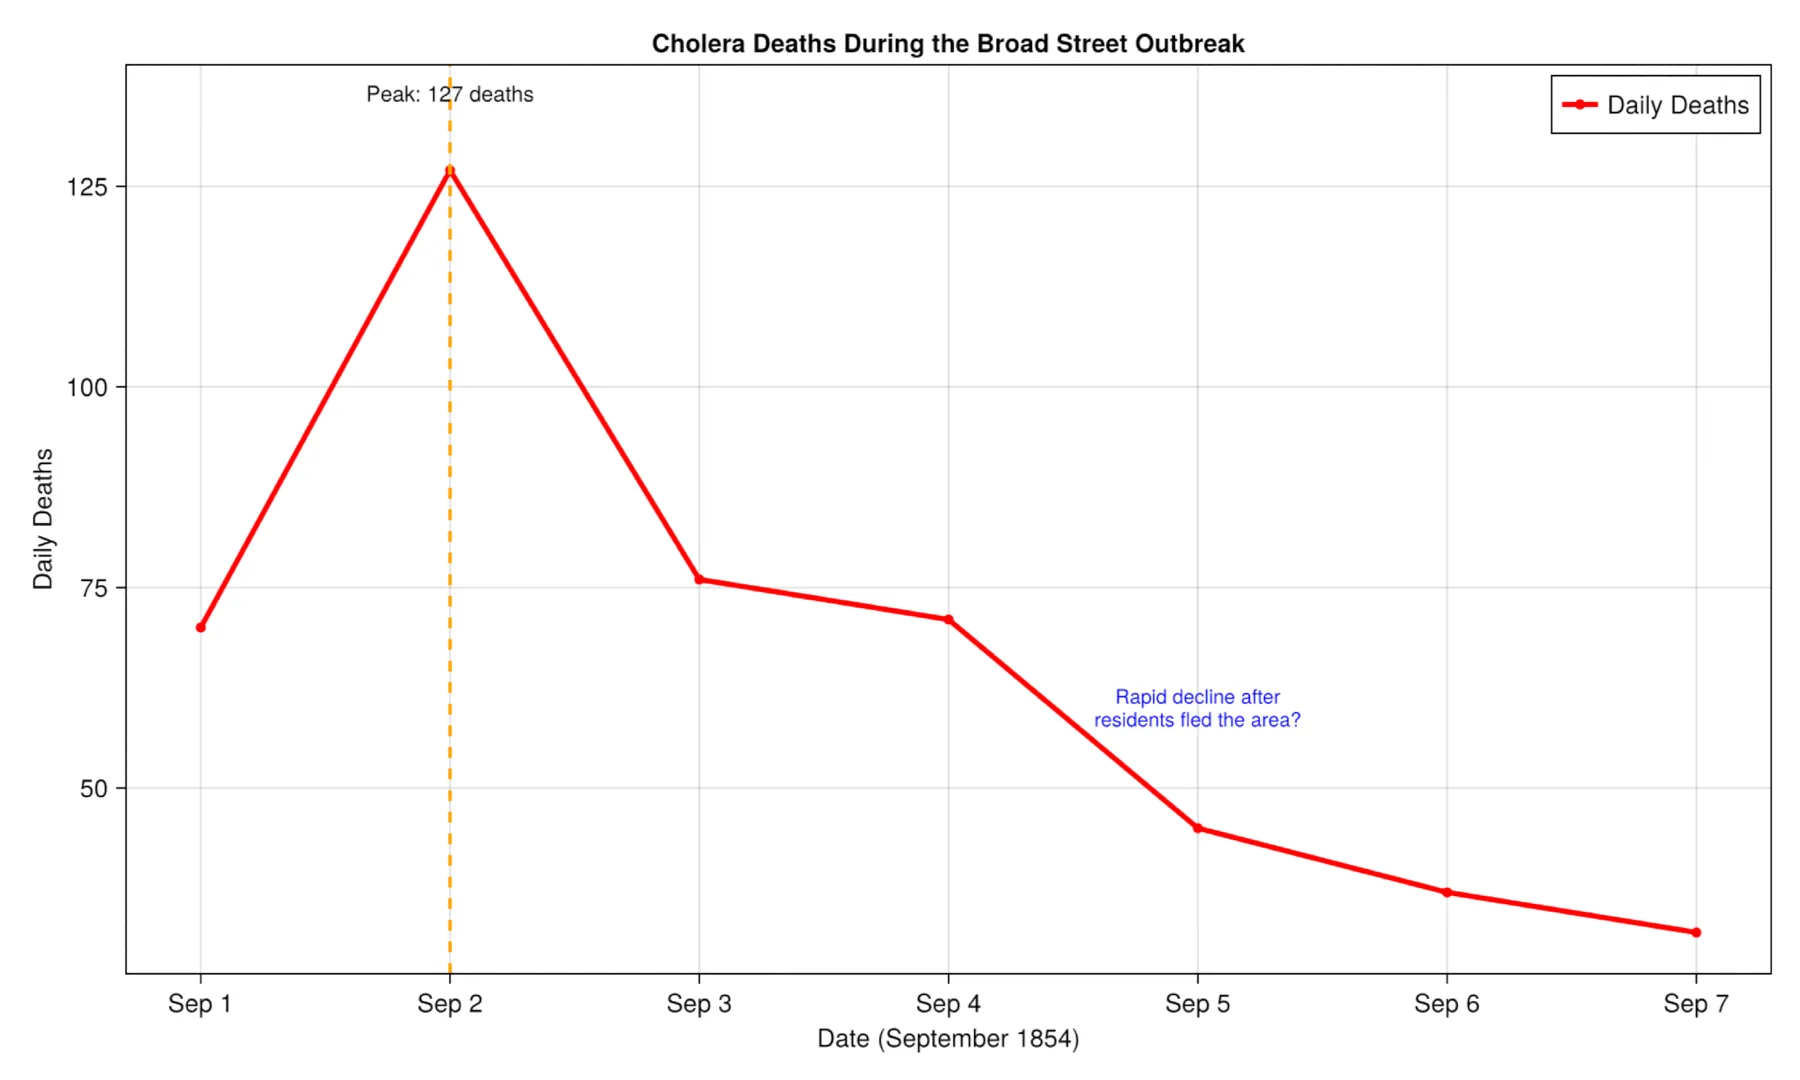
Time Series of the OutbreakOpen full size 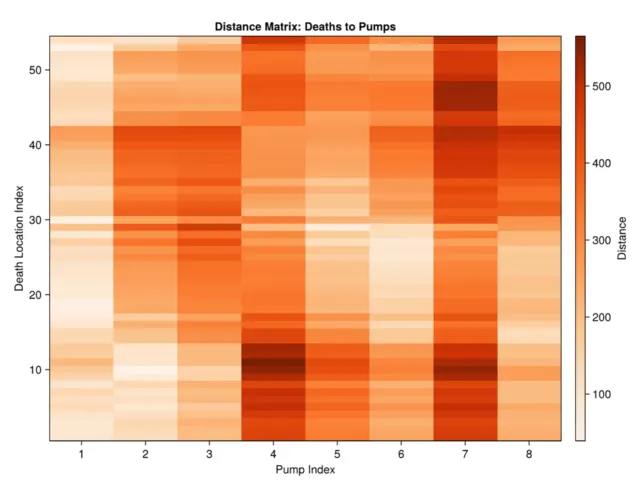
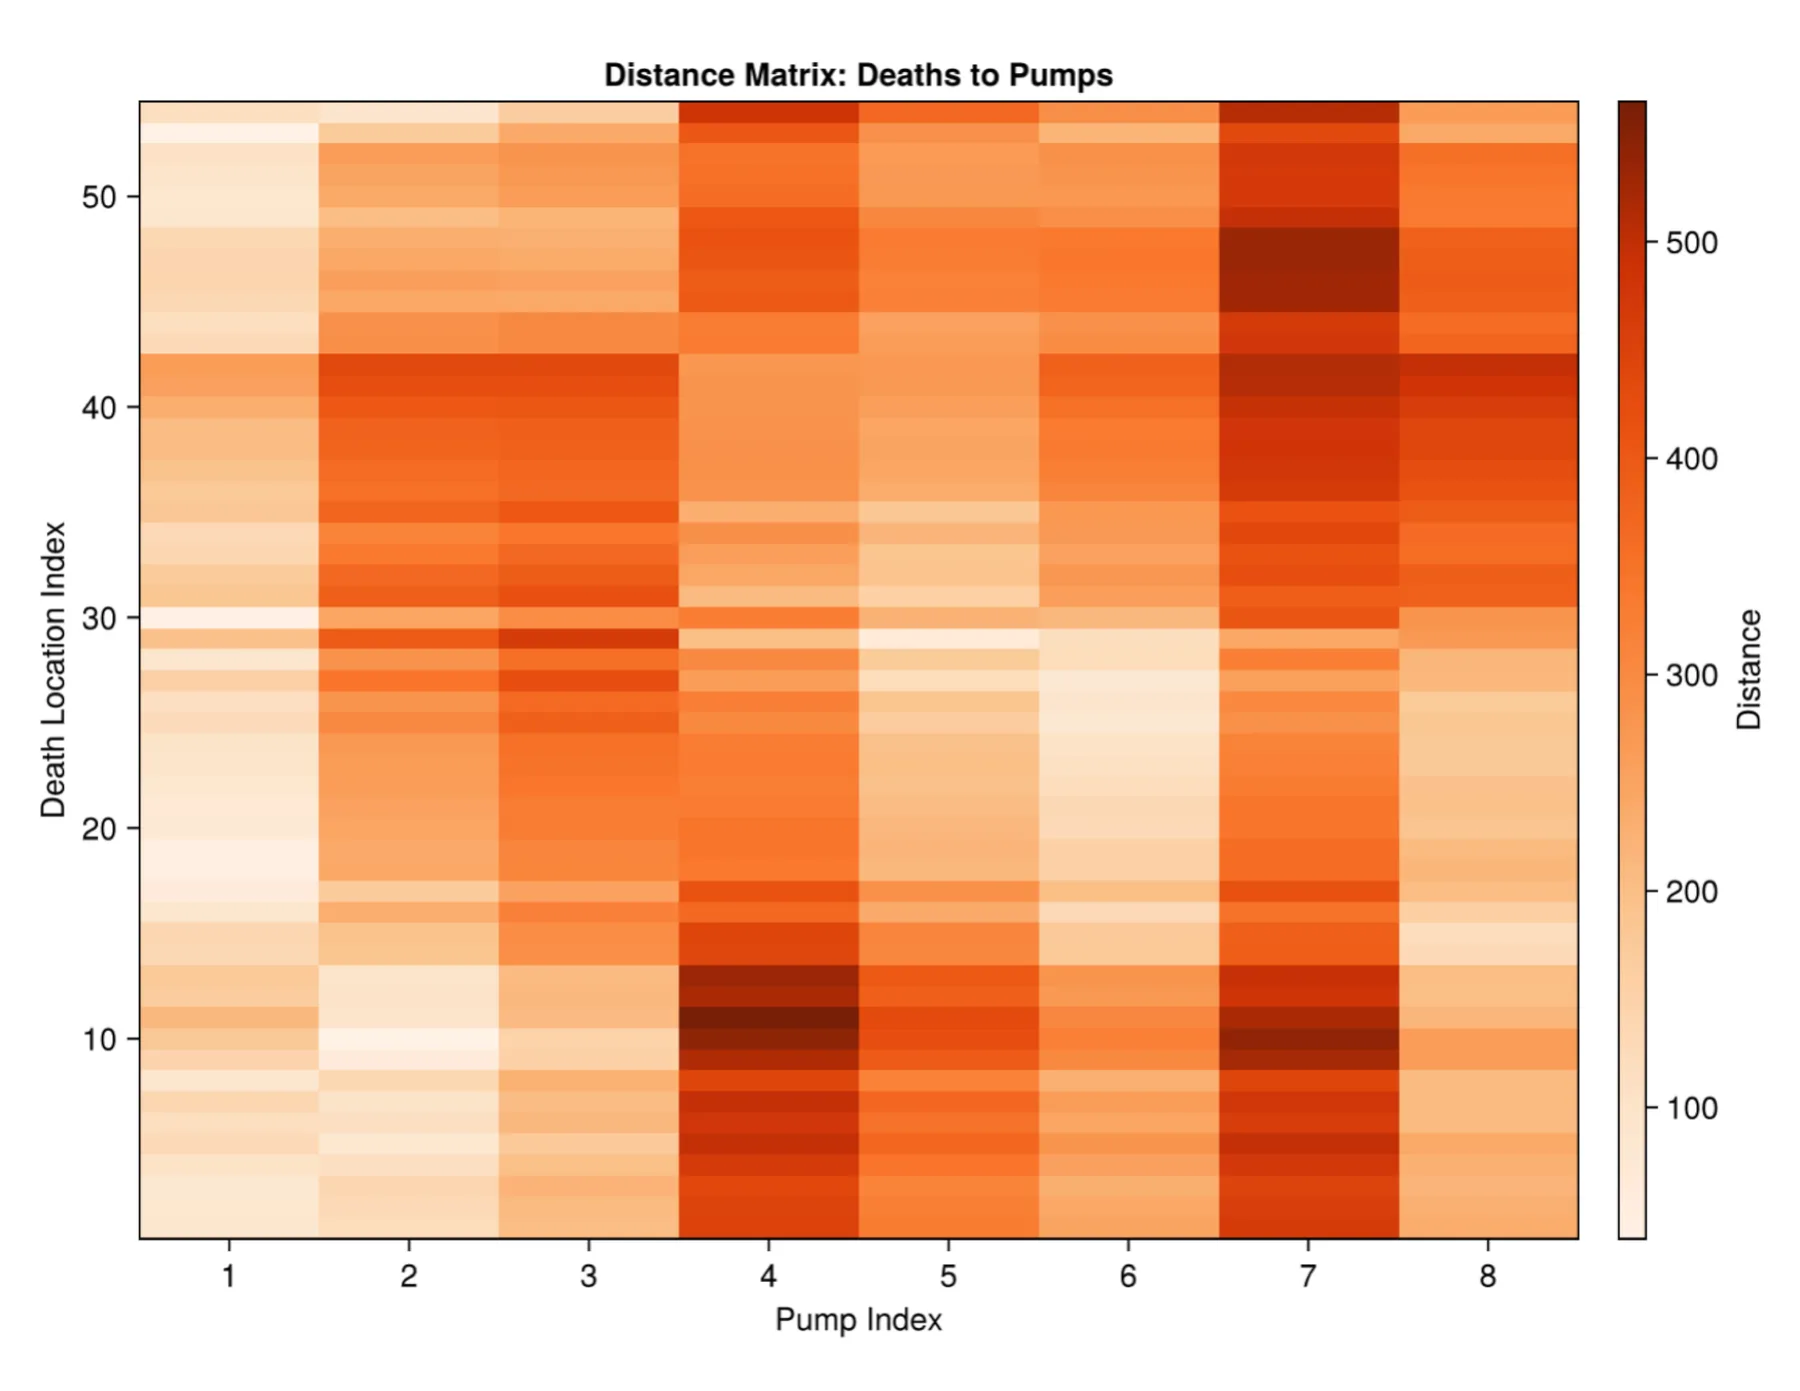
Heatmap of Simulated Distribution of First 70 CasesOpen full size 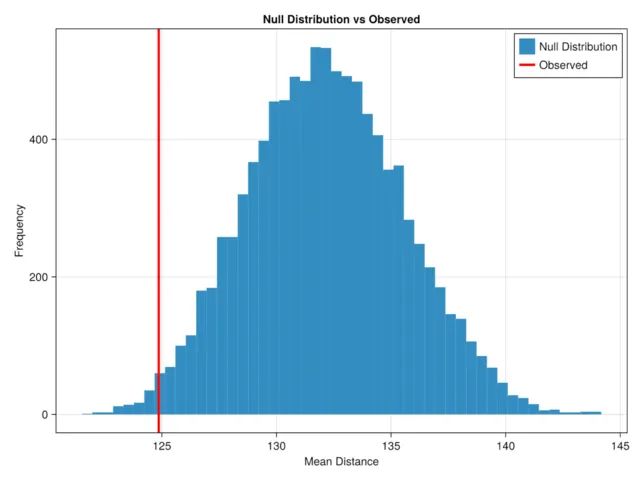
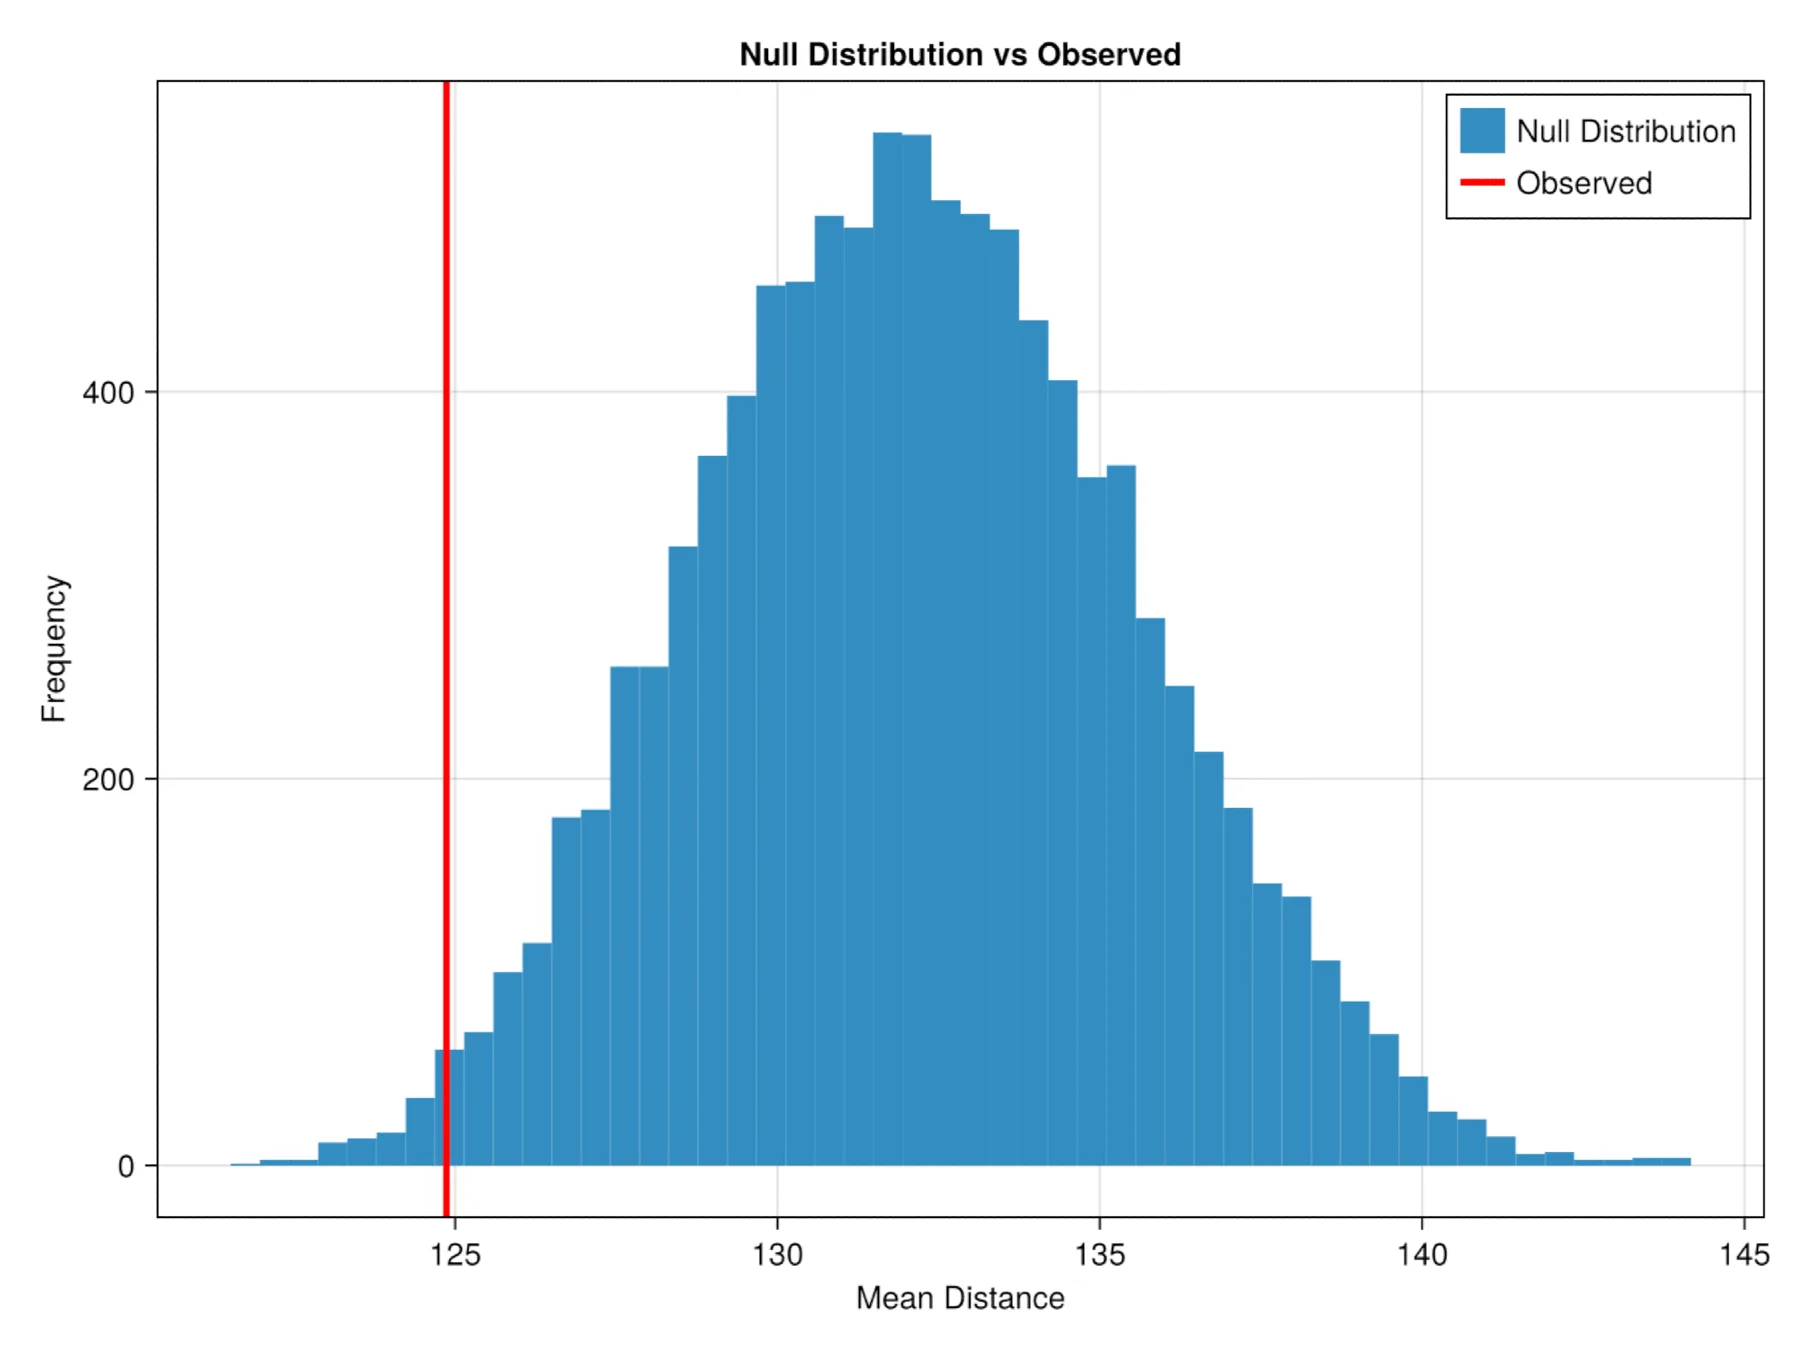
Permutation Test ResultOpen full size 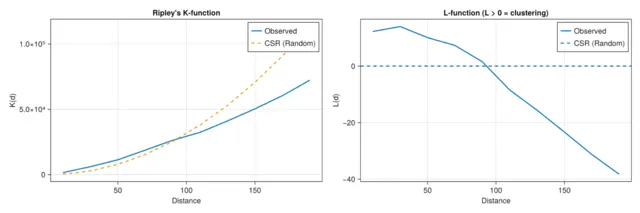
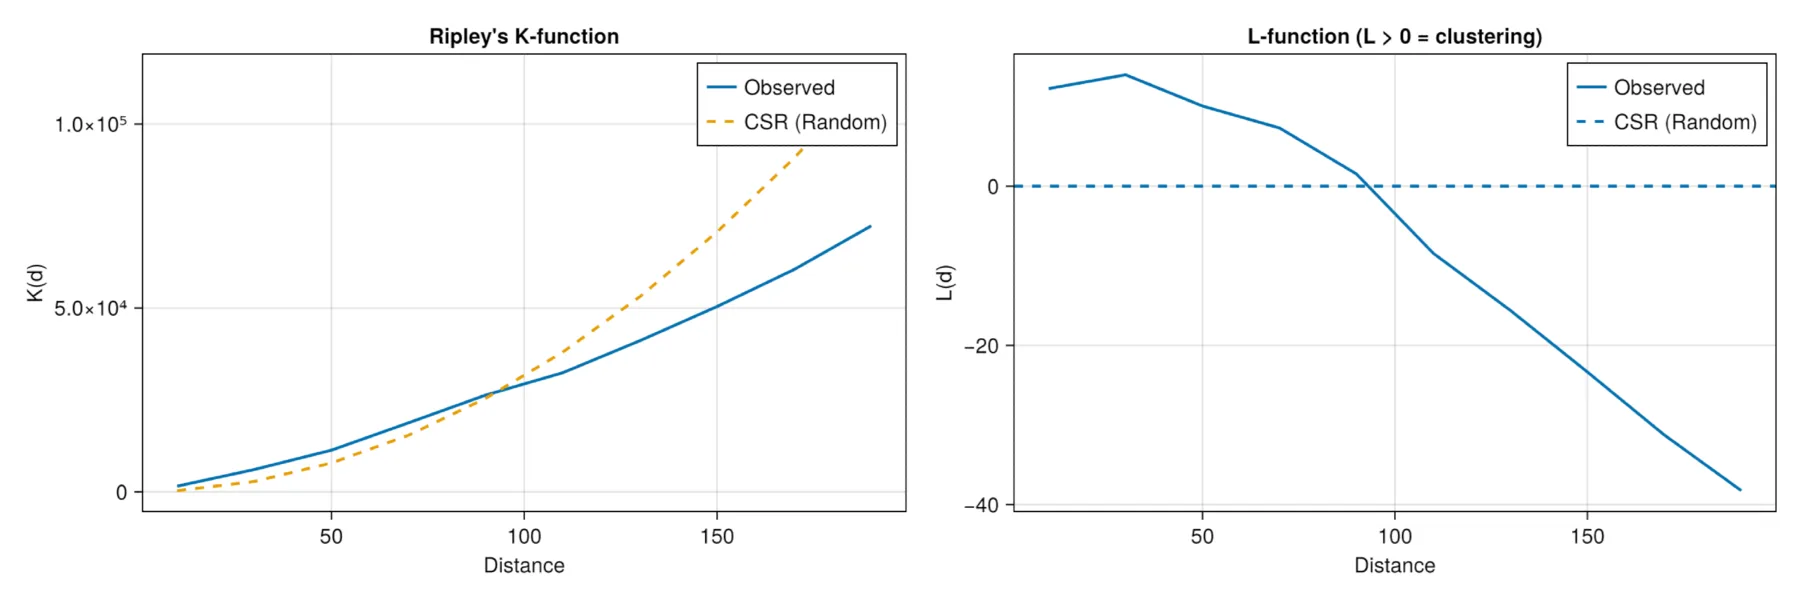
Permutation AnalysisOpen full size 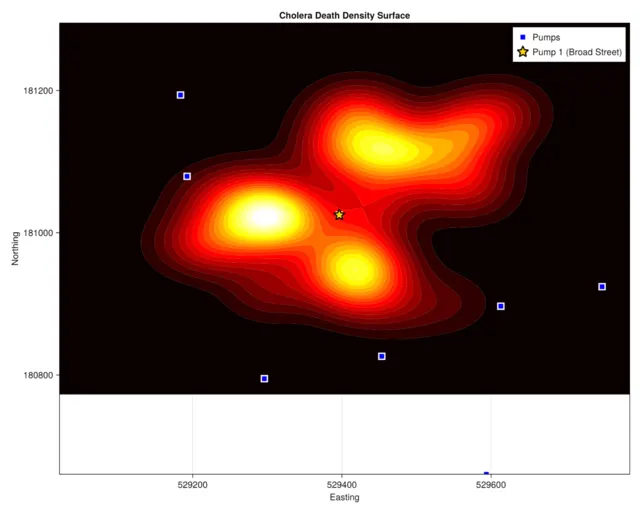
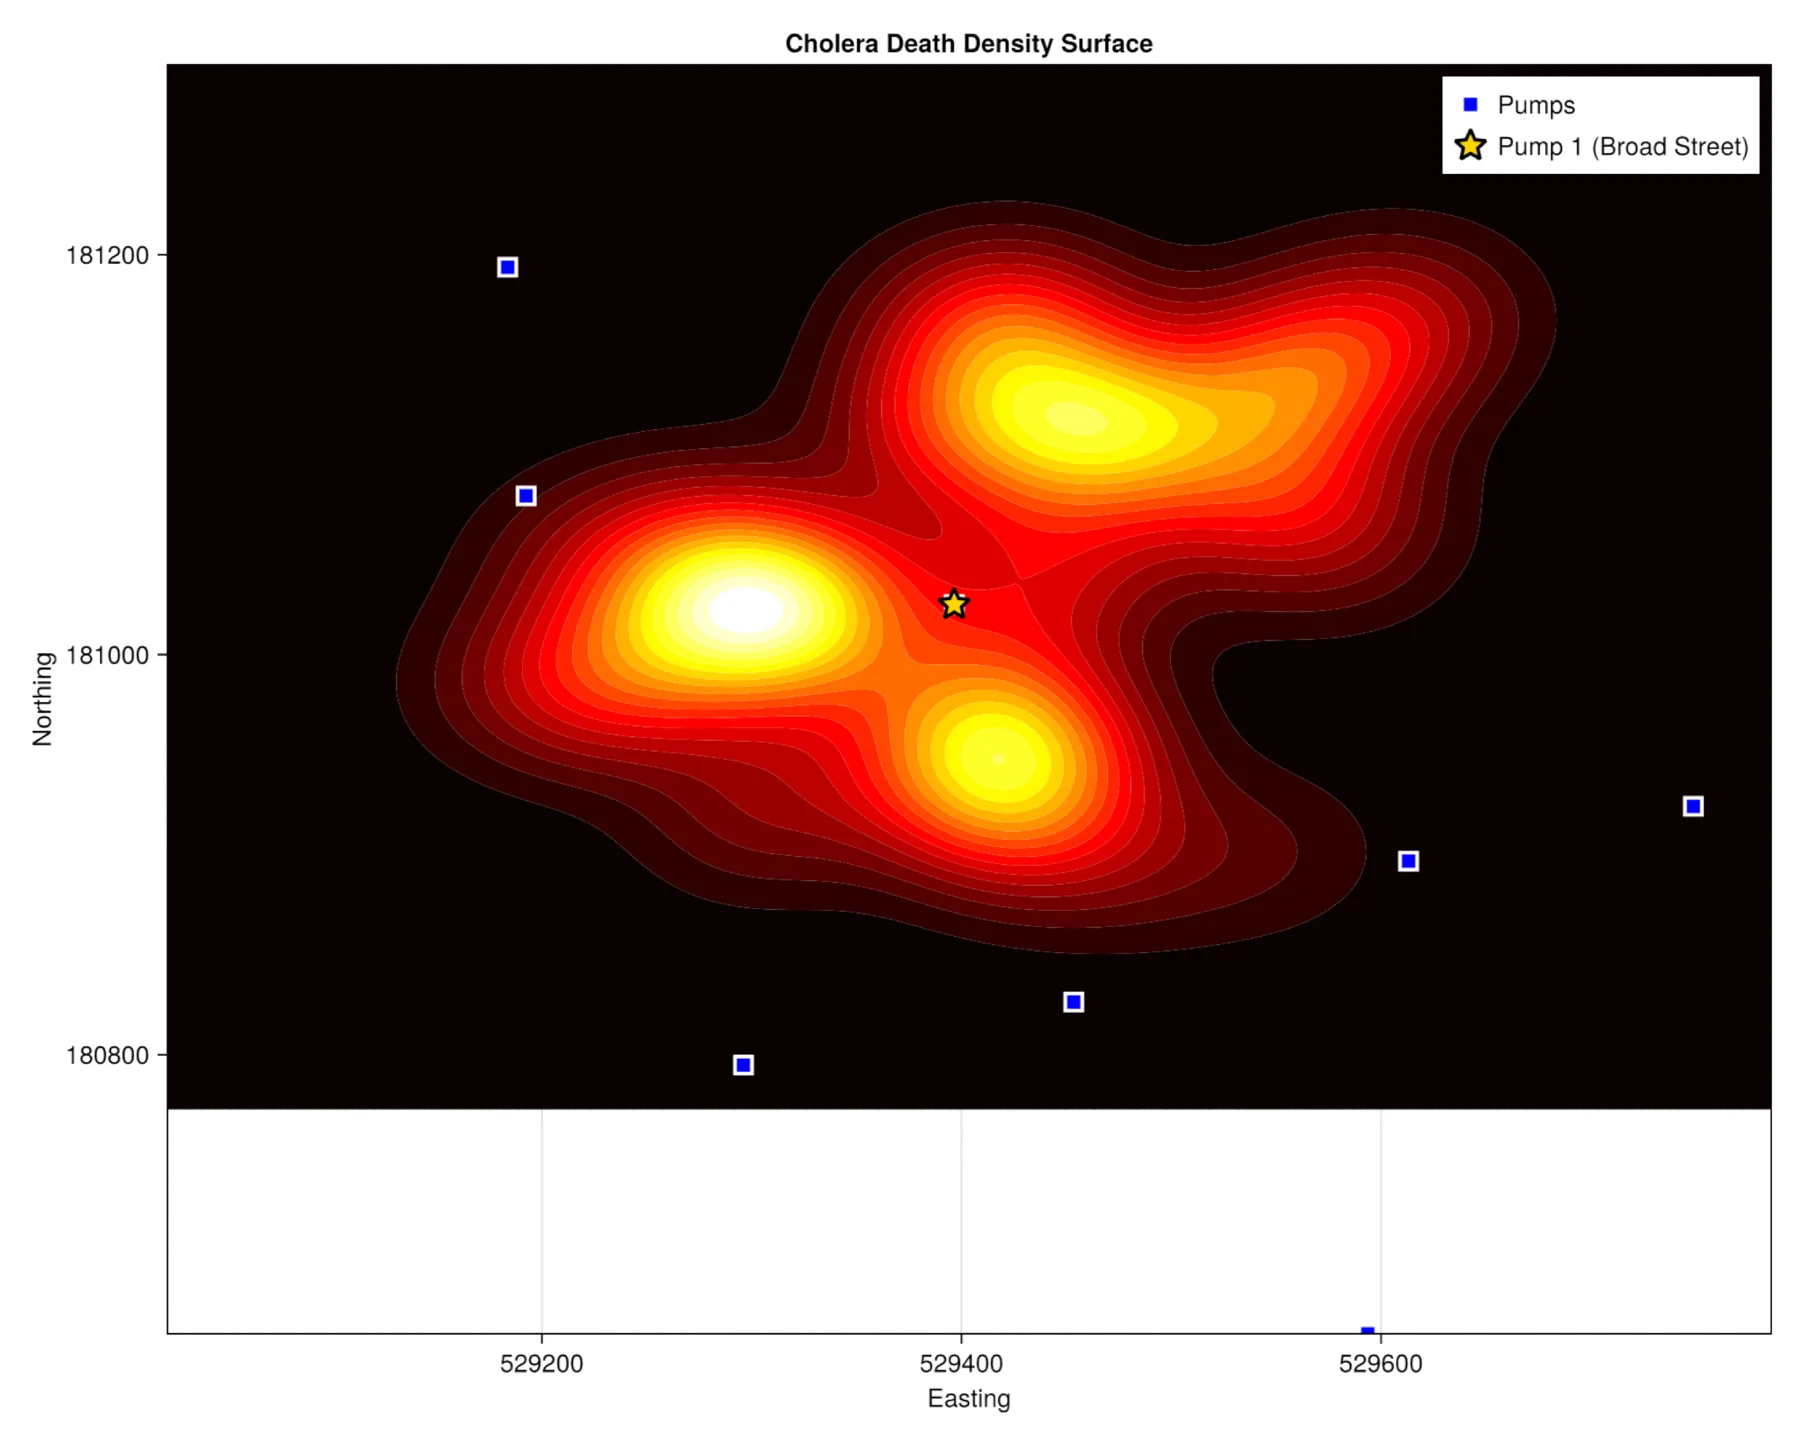
Density SurfaceOpen full size